

2. Intent Insight
An AI Twin's short term memory.
Introduction
Most market research relies on retrospection: a respondent recalling, summarizing, or rationalizing an intention well after the moment it was formed. Search behavior offers a different order of evidence, an unmediated trace of inquiry, captured at the moment it occurred, shaped by neither a survey instrument nor an interviewer. It is this distinction, between an intention as reported and an intention as enacted, that gives Intent Insight standing as a layer in its own right, rather than a subordinate view within Behavior Insight.
This is the Intent Layer described in IV. Insights & Intelligence: the What They Think. Where Behavior Insight maps the slower, accumulated shape of who an audience is, Intent Insight tracks something that moves much faster, real-time search intent and purchase intent, sourced directly from query data on Google. consumr.ai organizes those keyword and search signals into funnel stage, trend, seasonality, and correlated-keyword views, turning raw search demand into market research you can act on, whether that research shapes SEO strategy, content planning, media investment, or product positioning. Unlike Behavior Insight, an Intent report does not begin from a predefined audience. It begins from a topic.Choosing a Topic
Choosing a Topic
A research question rarely arrives fully formed. Sometimes you already know the exact phrase a consumer would type. Sometimes you only know the shape of the market you're curious about, not any one term within it. Sometimes you're starting from something concrete that already exists, a listing, a page, rather than a concept you'd have to name yourself. And sometimes the question hasn't taken shape at all, and all you can offer is a rough description of what you're trying to understand.
An Intent report starts in the Omnibox, the same "What do you want to understand today?" search bar used to generate every report on the platform, where you can enter a Keyword, a Category, or a URL, or describe what you're after in a Brief and let the platform work out the rest. The All tab accepts any of these without asking you to pick a type first, useful when you're not yet sure which input format fits best. Whichever input you choose, specificity is what determines the quality of the report: a well-defined topic returns something you can act on, a vague one returns noise. Once you've entered your topic, click Fetch Insights.
Topic Summary Card
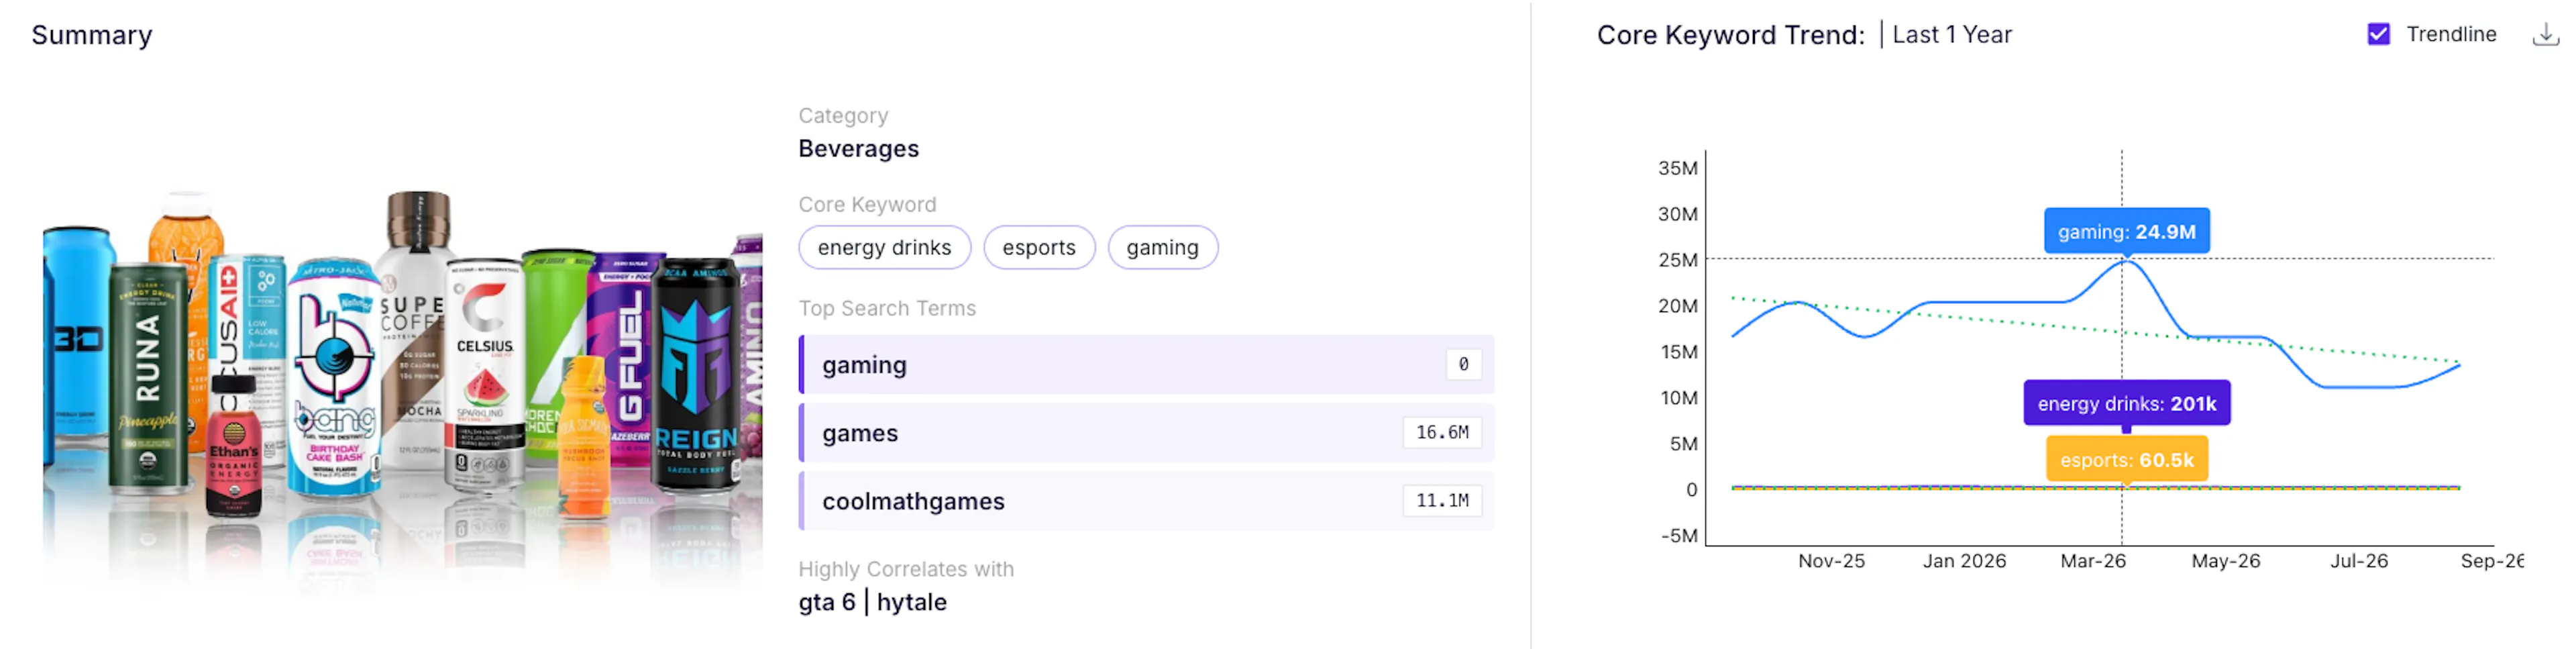
Everything else in the report hangs off this first card. It states the Category the topic sits in, the Core Keyword or keywords the report is anchored to, and the Top Search Terms, the highest-volume phrases tied directly to that topic. Highly Correlates With surfaces adjacent terms and brands that keep showing up in the same searches, often the fastest way to spot a competitor or category adjacency worth considering. A one-year Trend line closes the card, showing whether demand is climbing, flat, or fading.
Take a keyword input like "energy drinks, caffeine drinks, healthy energy drinks" The card opens by naming the Category it belongs to (Beverages), then lists the Core Keyword or keywords the whole report is anchored to, so you always know exactly what population of searches you're looking at.
Below that, Top Search Terms surfaces the highest-volume phrases people are actually typing alongside your topic, terms like "energetic drinks" or "celsius drinks" might appear here even though neither one is your core keyword, because search behavior rarely stays inside the exact phrase you started with. Highly Correlates With takes that a step further: it names the specific adjacent terms and brands that consistently show up in the same searches as your topic, which is often the fastest way to notice a competitor sitting closer to your demand than you realized, or a category adjacency worth building content around.
The Trend line closes the card with a full year of search volume, so you can see the shape of demand at a glance rather than a single snapshot number: a line that climbs toward the right edge says interest is building, a flat line says the topic has settled into a steady baseline, and a line that dips says attention is moving elsewhere.
Consumer Mindset Parameters
Search volume tells you how much people care. This card tells you why, and it does it by showing you the actual questions behind the numbers, organized into three tabs.
Questions Asked groups real, unedited search questions into sub-themes (like in this case, Health, Nutrition, Brands, Availability, and Ranking), so you can see at a glance where curiosity or hesitation is concentrated. Under Health, for an energy drinks topic, you might see "Can energy drinks raise cholesterol?" or "Are energy drinks bad for pancreatitis?" flagged High Volume, telling you these aren't niche worries, they're common enough to build a dedicated FAQ or content piece around. Under Availability, something as practical as "energy drinks near me drive thru" shows up, a completely different kind of intent from a health question, and worth a completely different response. Reading down the columns rather than up a single one usually reveals where the audience's attention is actually clustering.
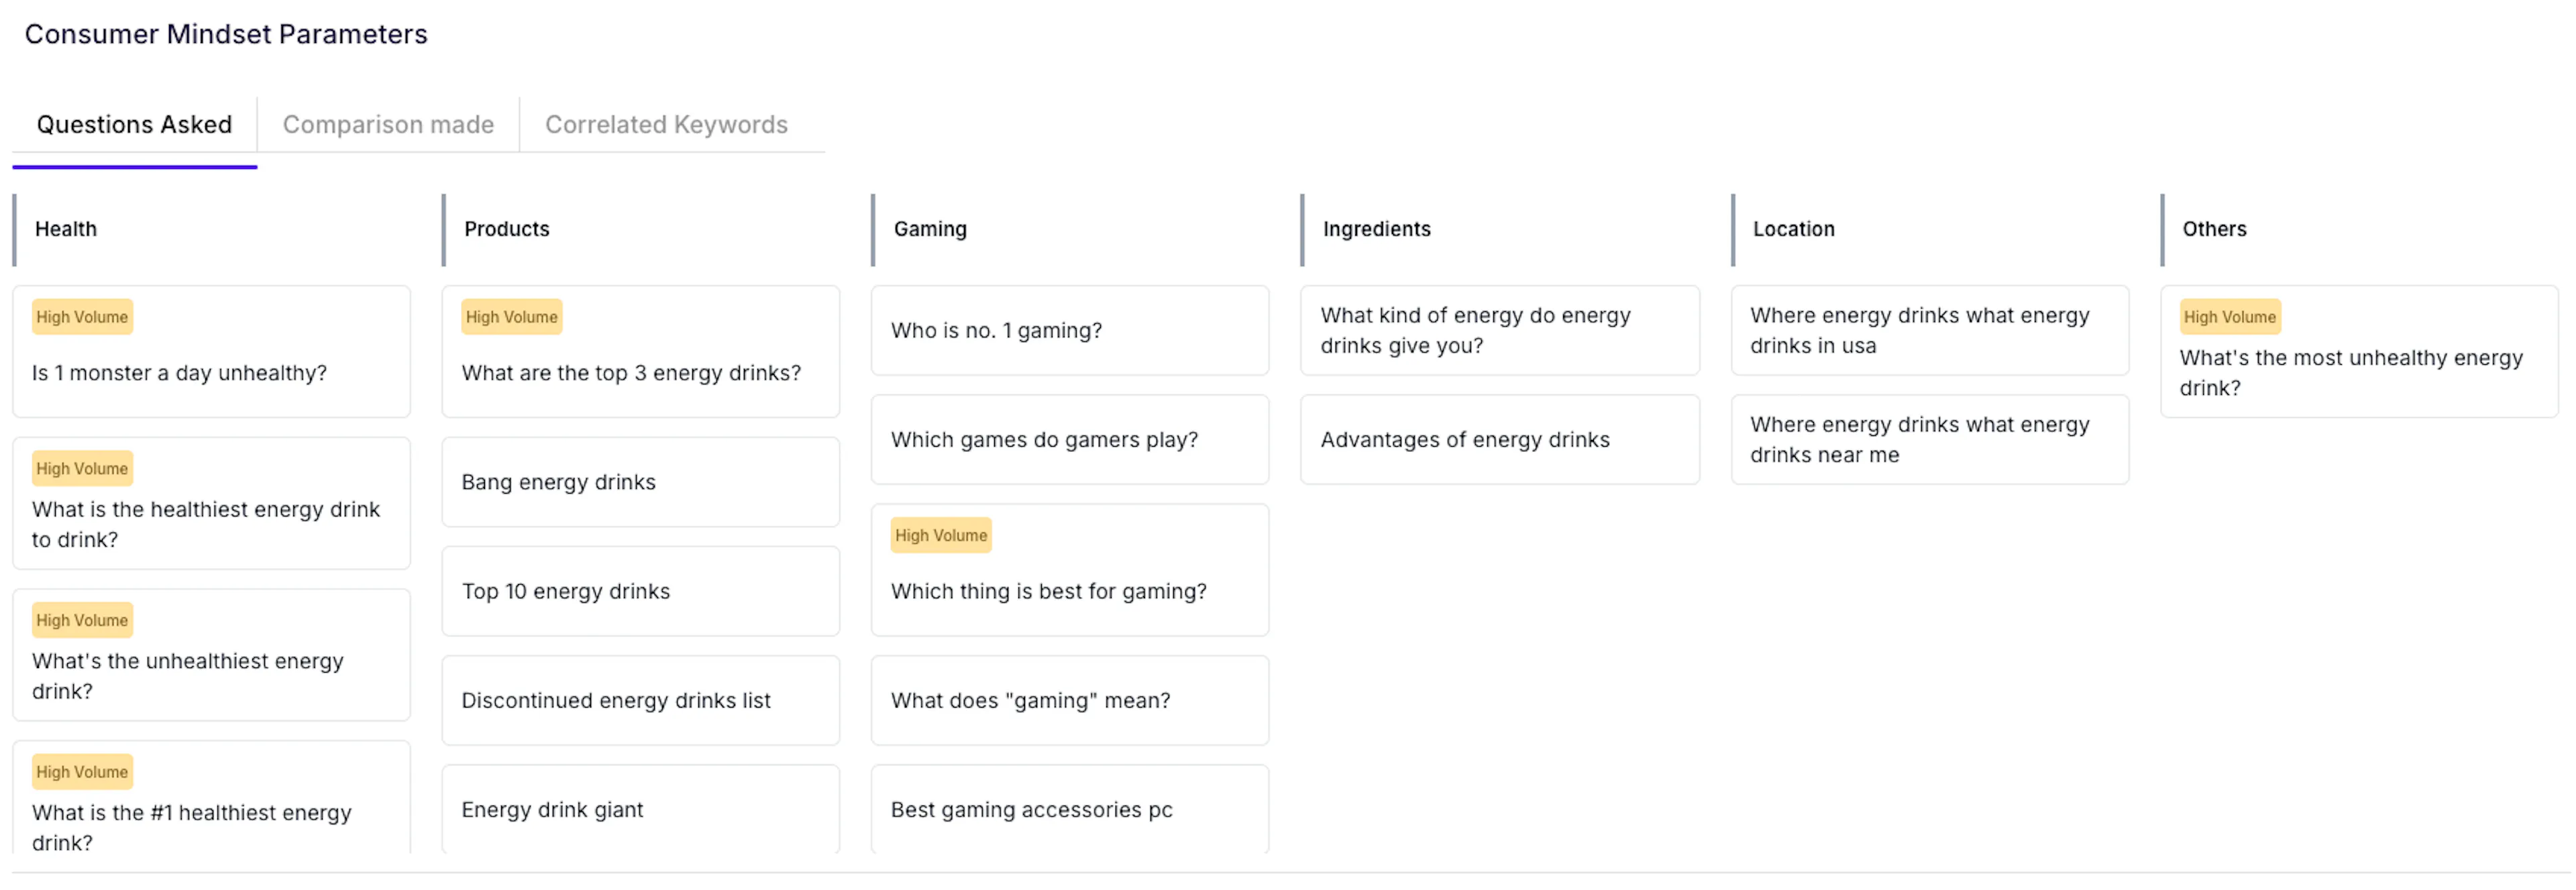
Comparison Made shows the products, brands, or alternatives your topic gets weighed against in the same search session, the mental shortlist a consumer is working through before they commit to anything.
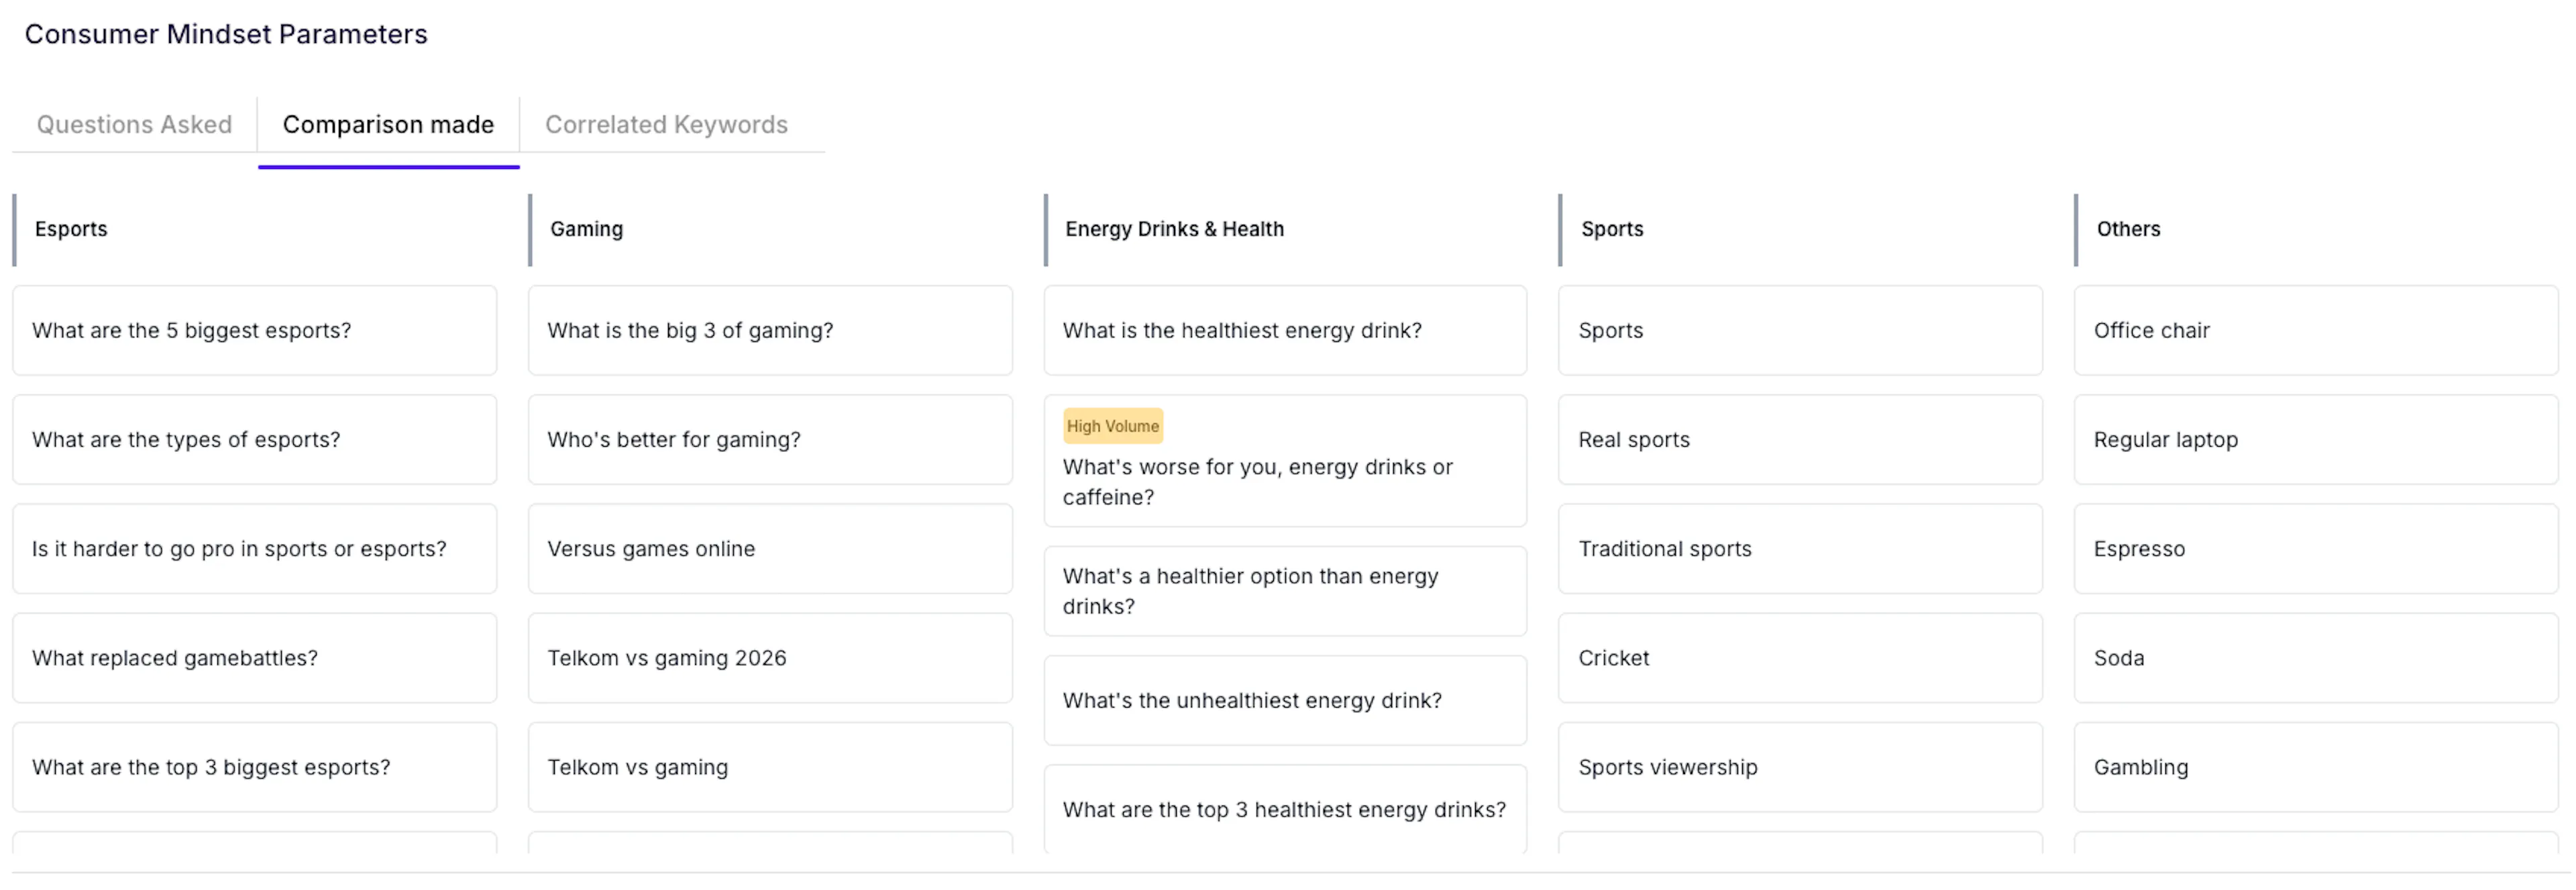
Correlated Keywords lists the terms that consistently appear alongside searches for your topic, a practical map of where your own keyword targeting could expand next, built from what real searchers already associate with the topic rather than a guess at what they might.
The Conversion Funnel
Total search volume splits into three stages, and the split itself is often more revealing than the total number.
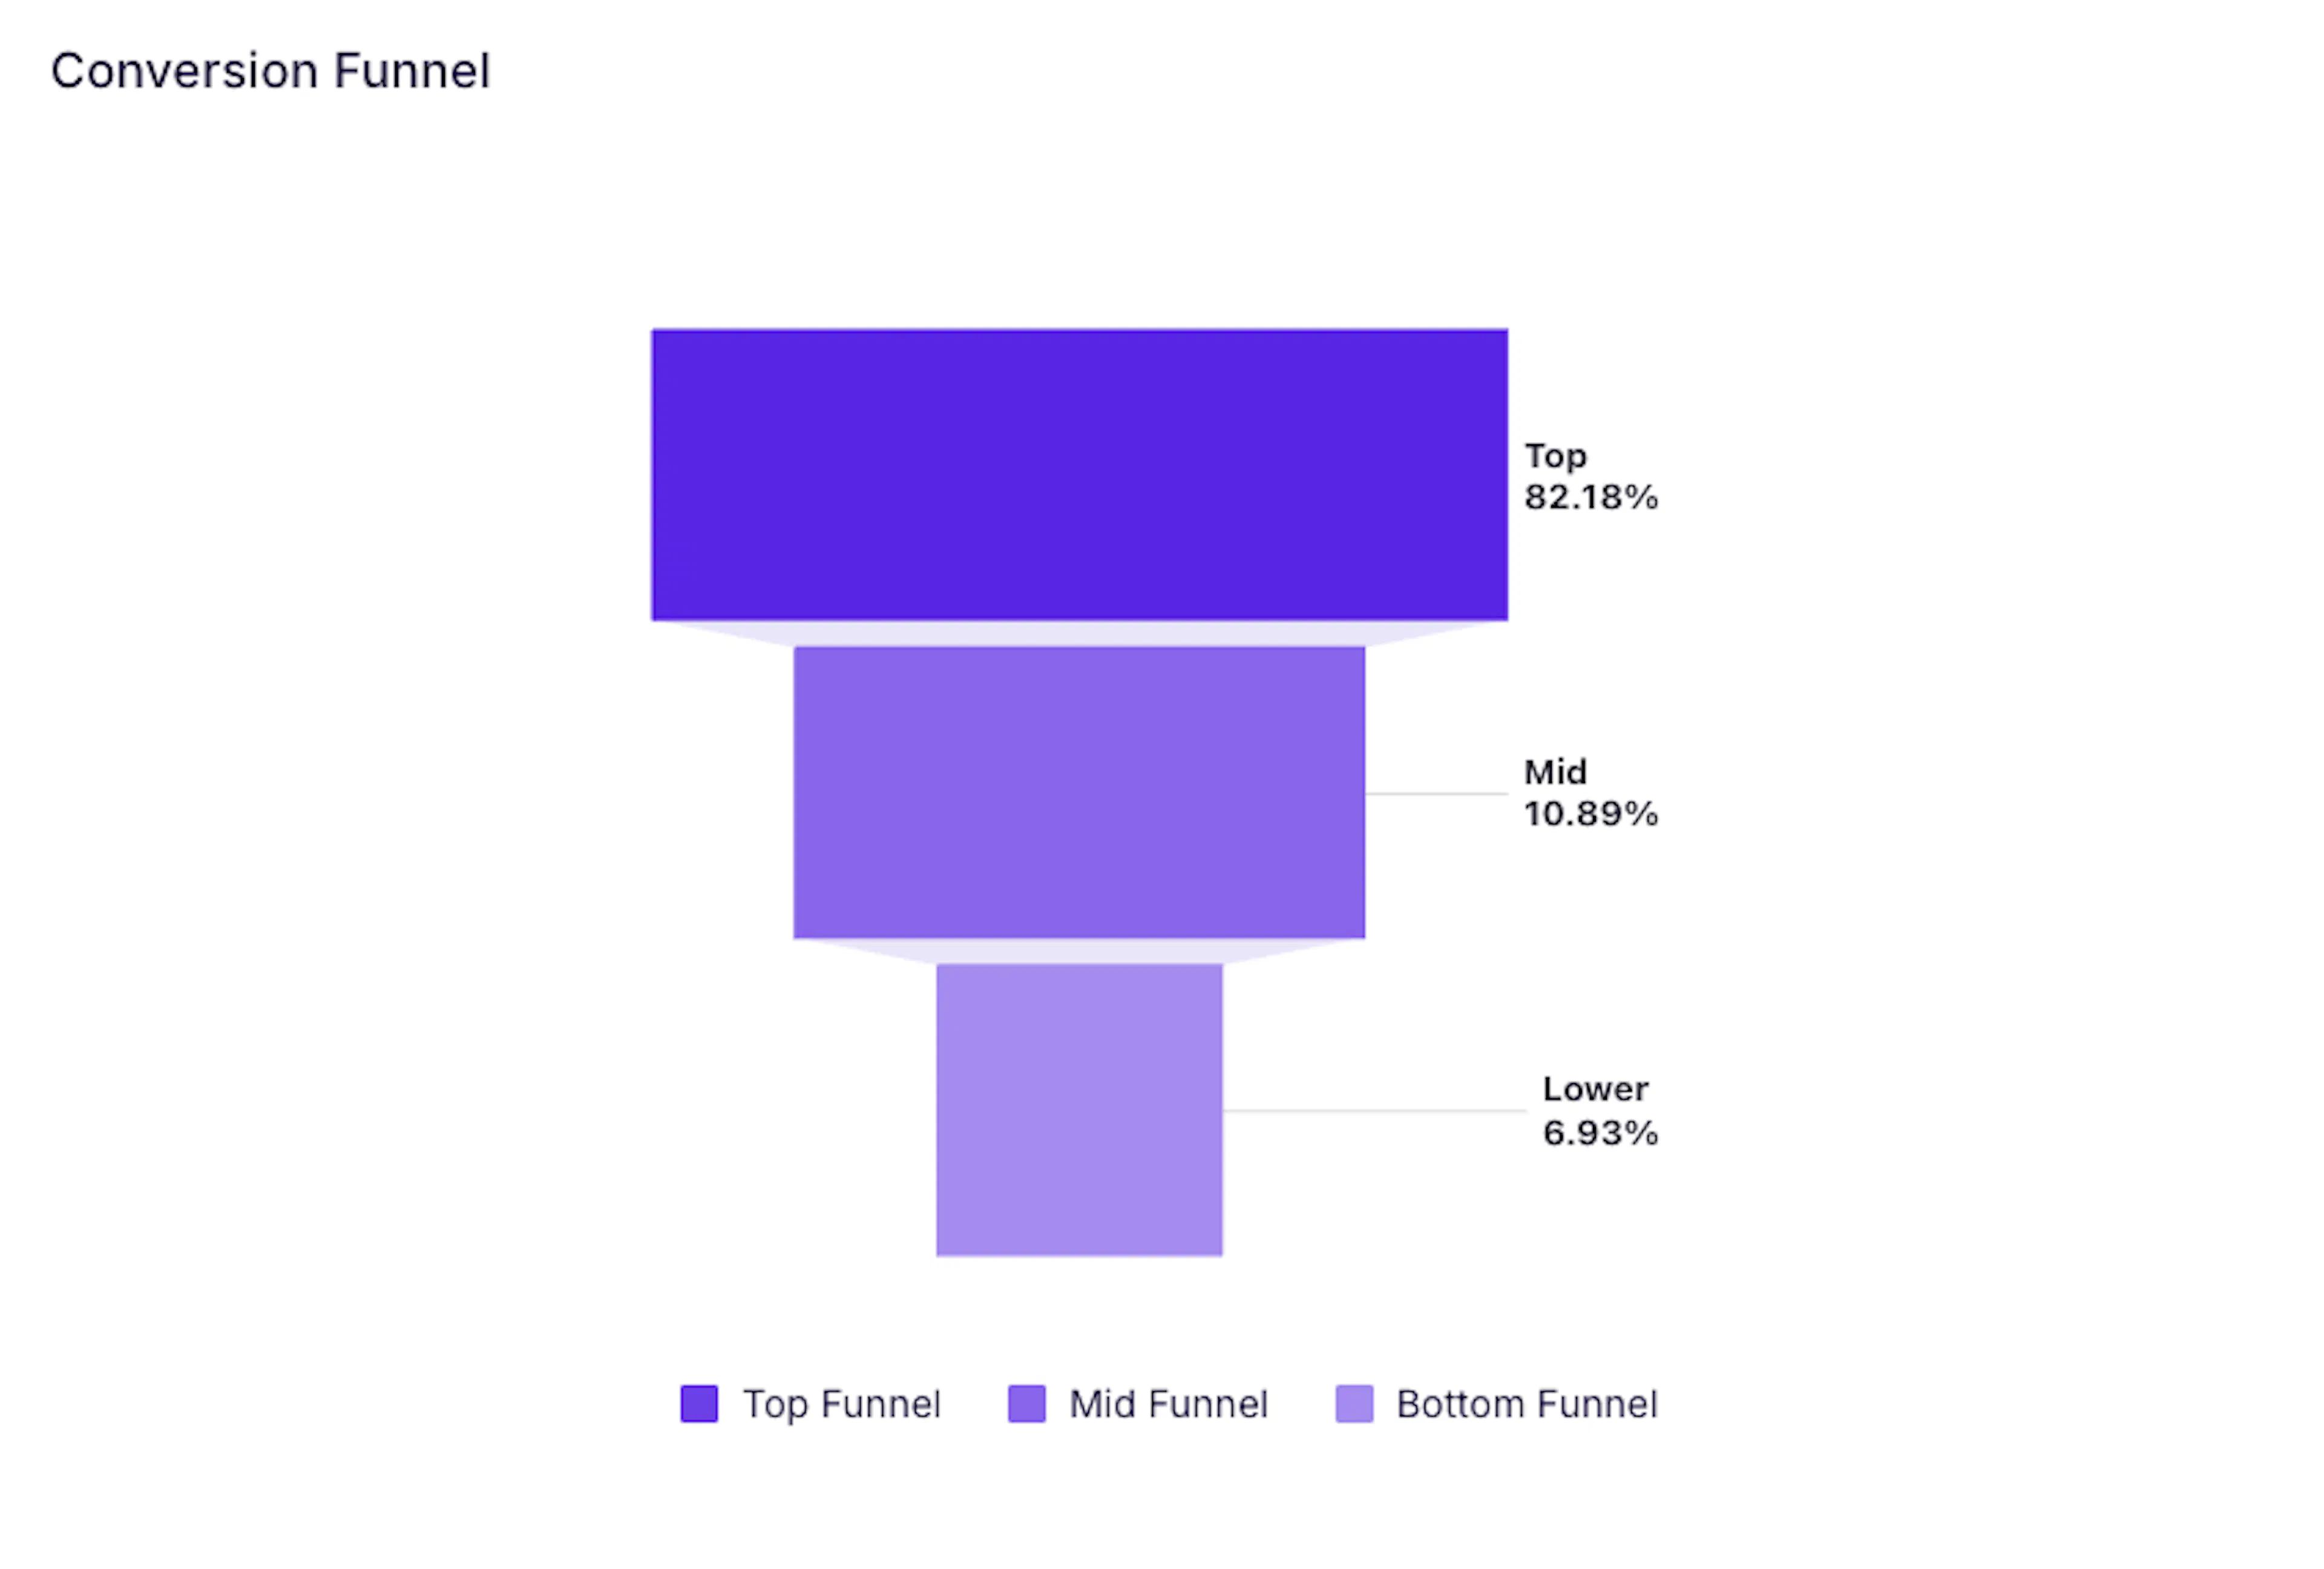
- Top Funnel covers early, broad awareness searches, someone just becoming curious about a category.
- Mid Funnel covers consideration and comparison, someone actively weighing options.
- Lower Funnel covers the searches people make right before they act, close to a decision or already looking to buy.
A topic that splits roughly 41% Top, 44% Mid, and 16% Lower, for instance, is telling you this audience spends most of its search energy exploring and comparing, and relatively little of it in a ready-to-buy state, a very different picture than a topic where Lower Funnel dominates.
Alongside the funnel sits a second trendline, sorting the same volume into four shapes:
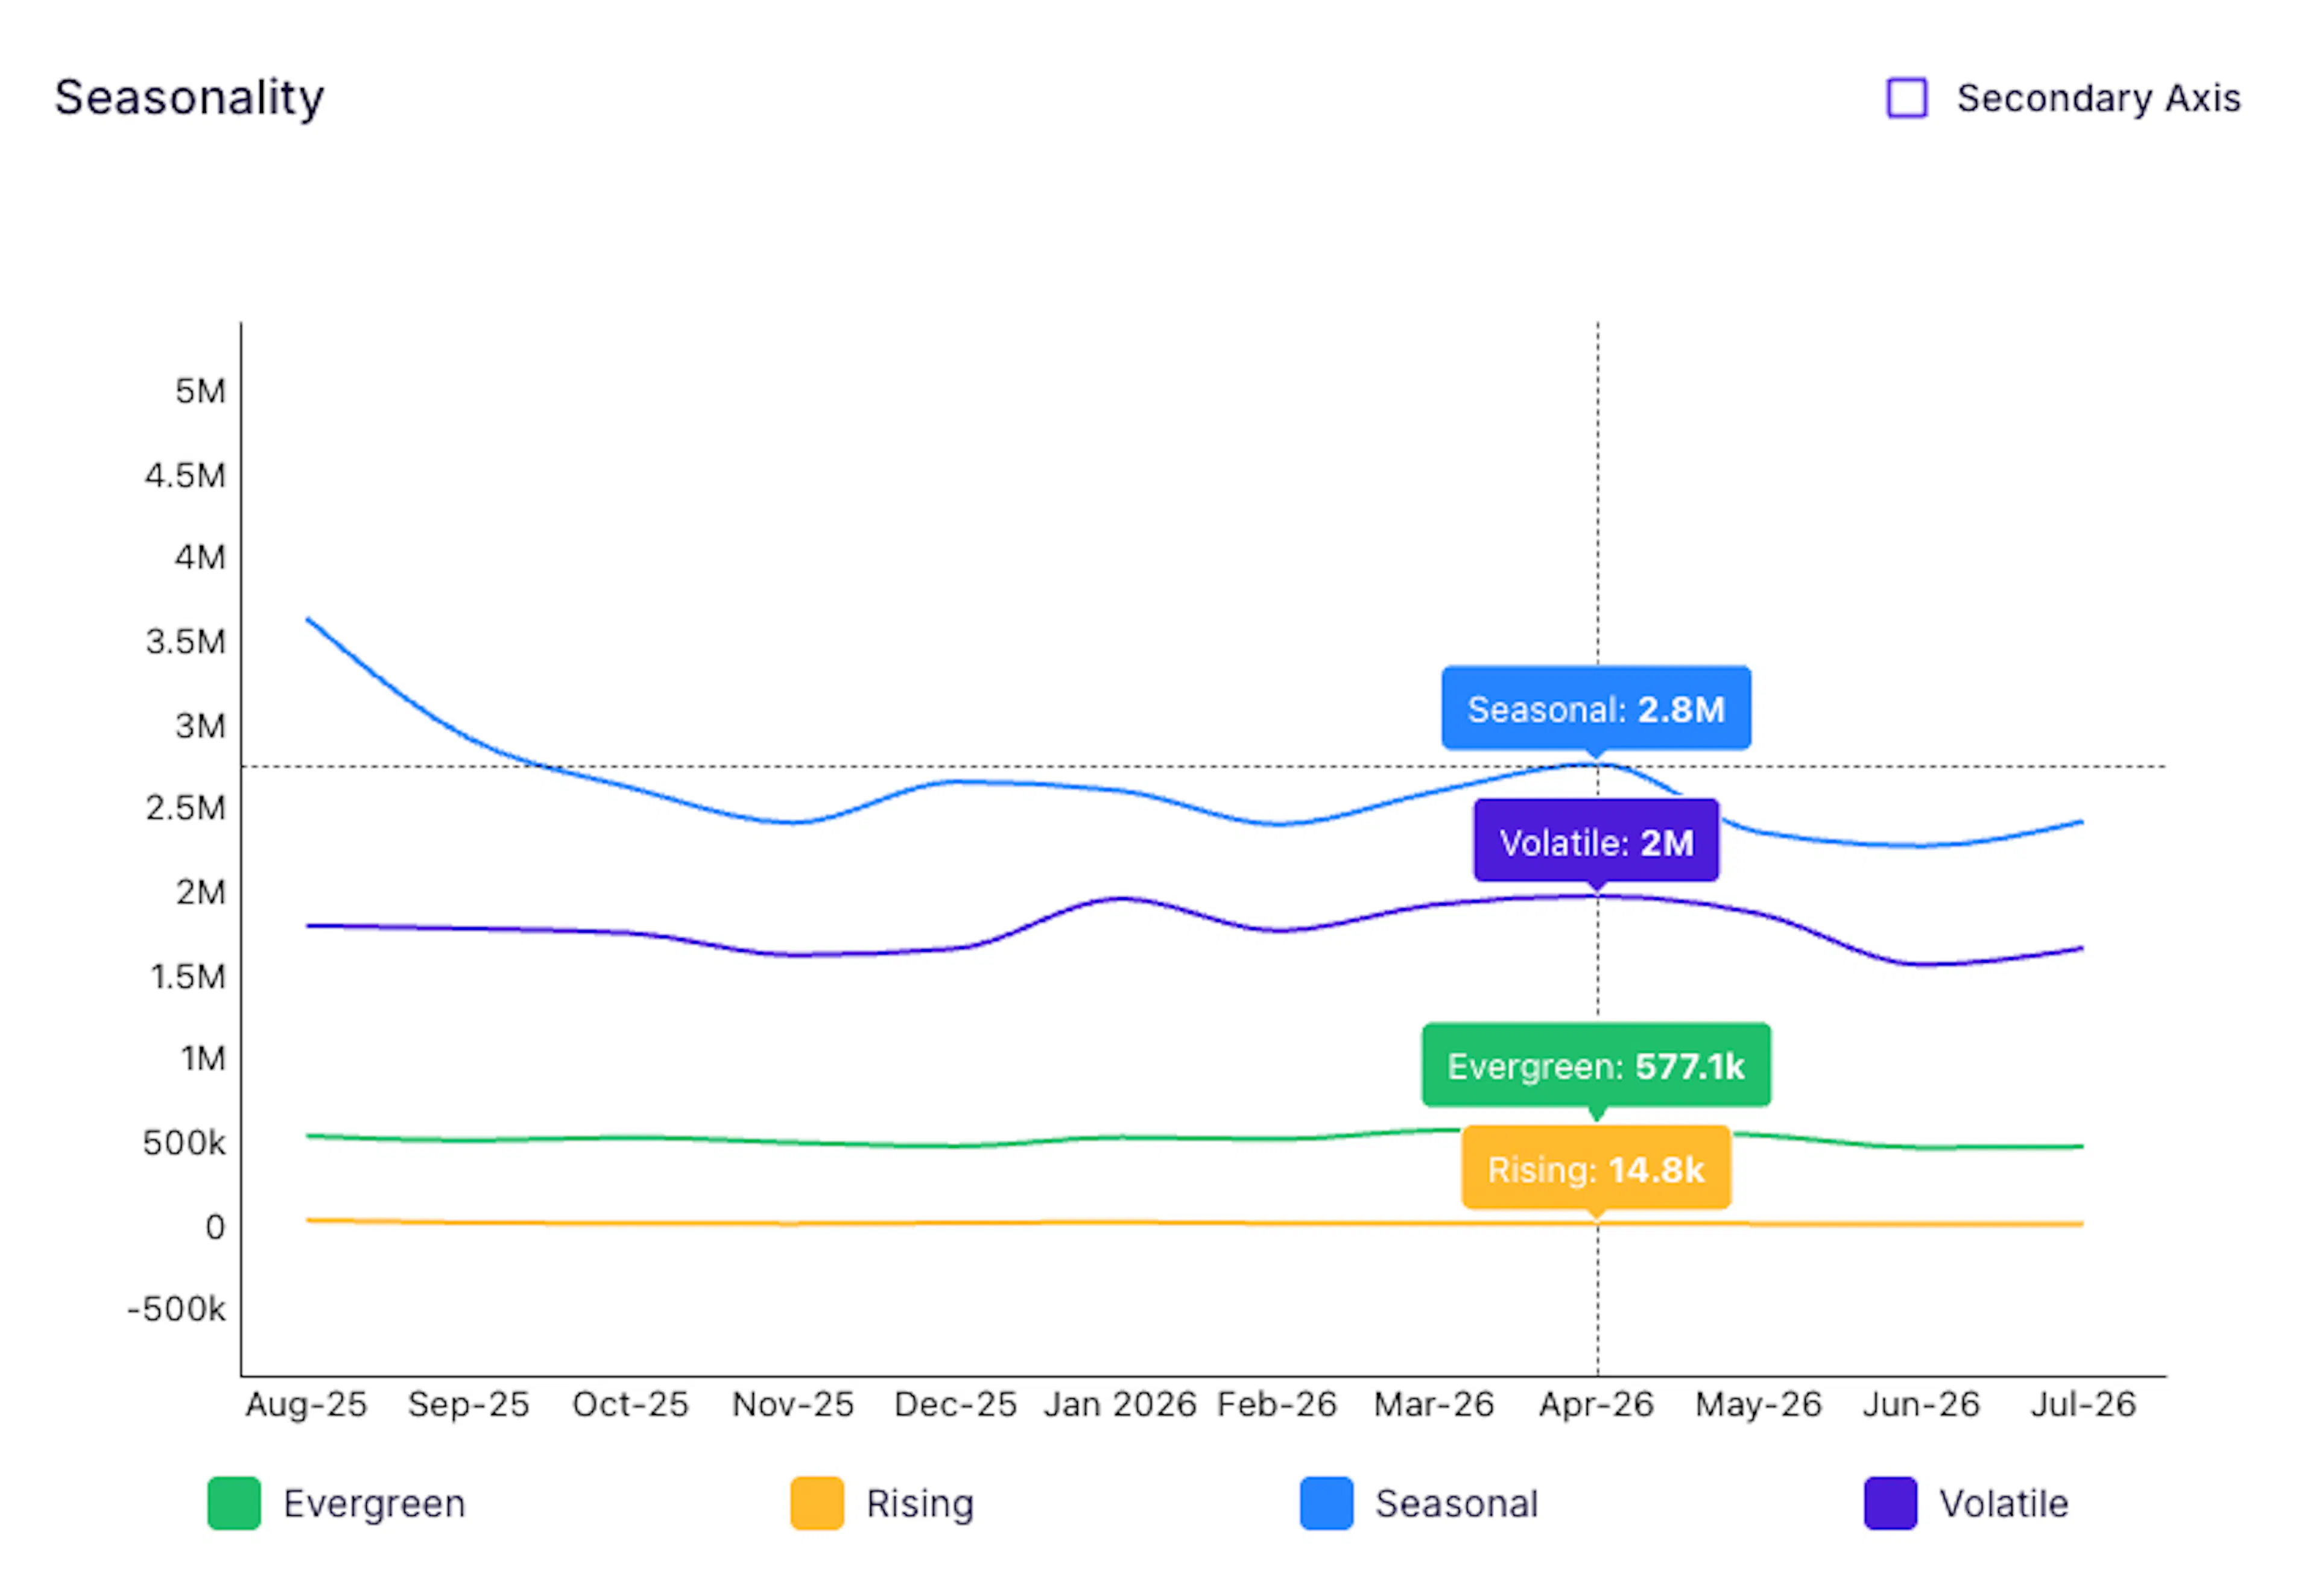
- Evergreen, a steady, flat baseline that holds roughly constant year-round.
- Rising, a line that climbs and keeps climbing, a genuine trend still gaining ground rather than a temporary spike.
- Seasonal, a pattern that repeats predictably around the same time each year, tied to a season, holiday, or calendar event.
- Volatile, a line with sharp, sudden peaks that don't follow any obvious calendar pattern, demand that spikes and falls off quickly.
A topic where Seasonal and Volatile dominate the total, with only a small Evergreen floor and almost no Rising volume, is telling you something specific: most of the interest in this topic is either cyclical or already established, and very little of it represents a new trend still forming. That composition should shape your timing. Lean into the Seasonal peaks when they're predictable, stay ready to react quickly when Volatile spikes hit, and don't expect the Evergreen baseline to move much no matter what you do.
Categories & Top Themes
Categories breaks total search volume into sub-categories, each with its own volume attached and a running total across all of them. For a games topic, for instance, Games itself might carry 170.5m of a 187.7m total across four categories, with Consoles, Other, and GamingGear splitting the remaining fraction between them. A distribution that lopsided is itself the finding: this topic's demand is overwhelmingly generic search behavior around games as a category, not people specifically shopping for consoles or gear, however many individual product questions might show up elsewhere in the report.
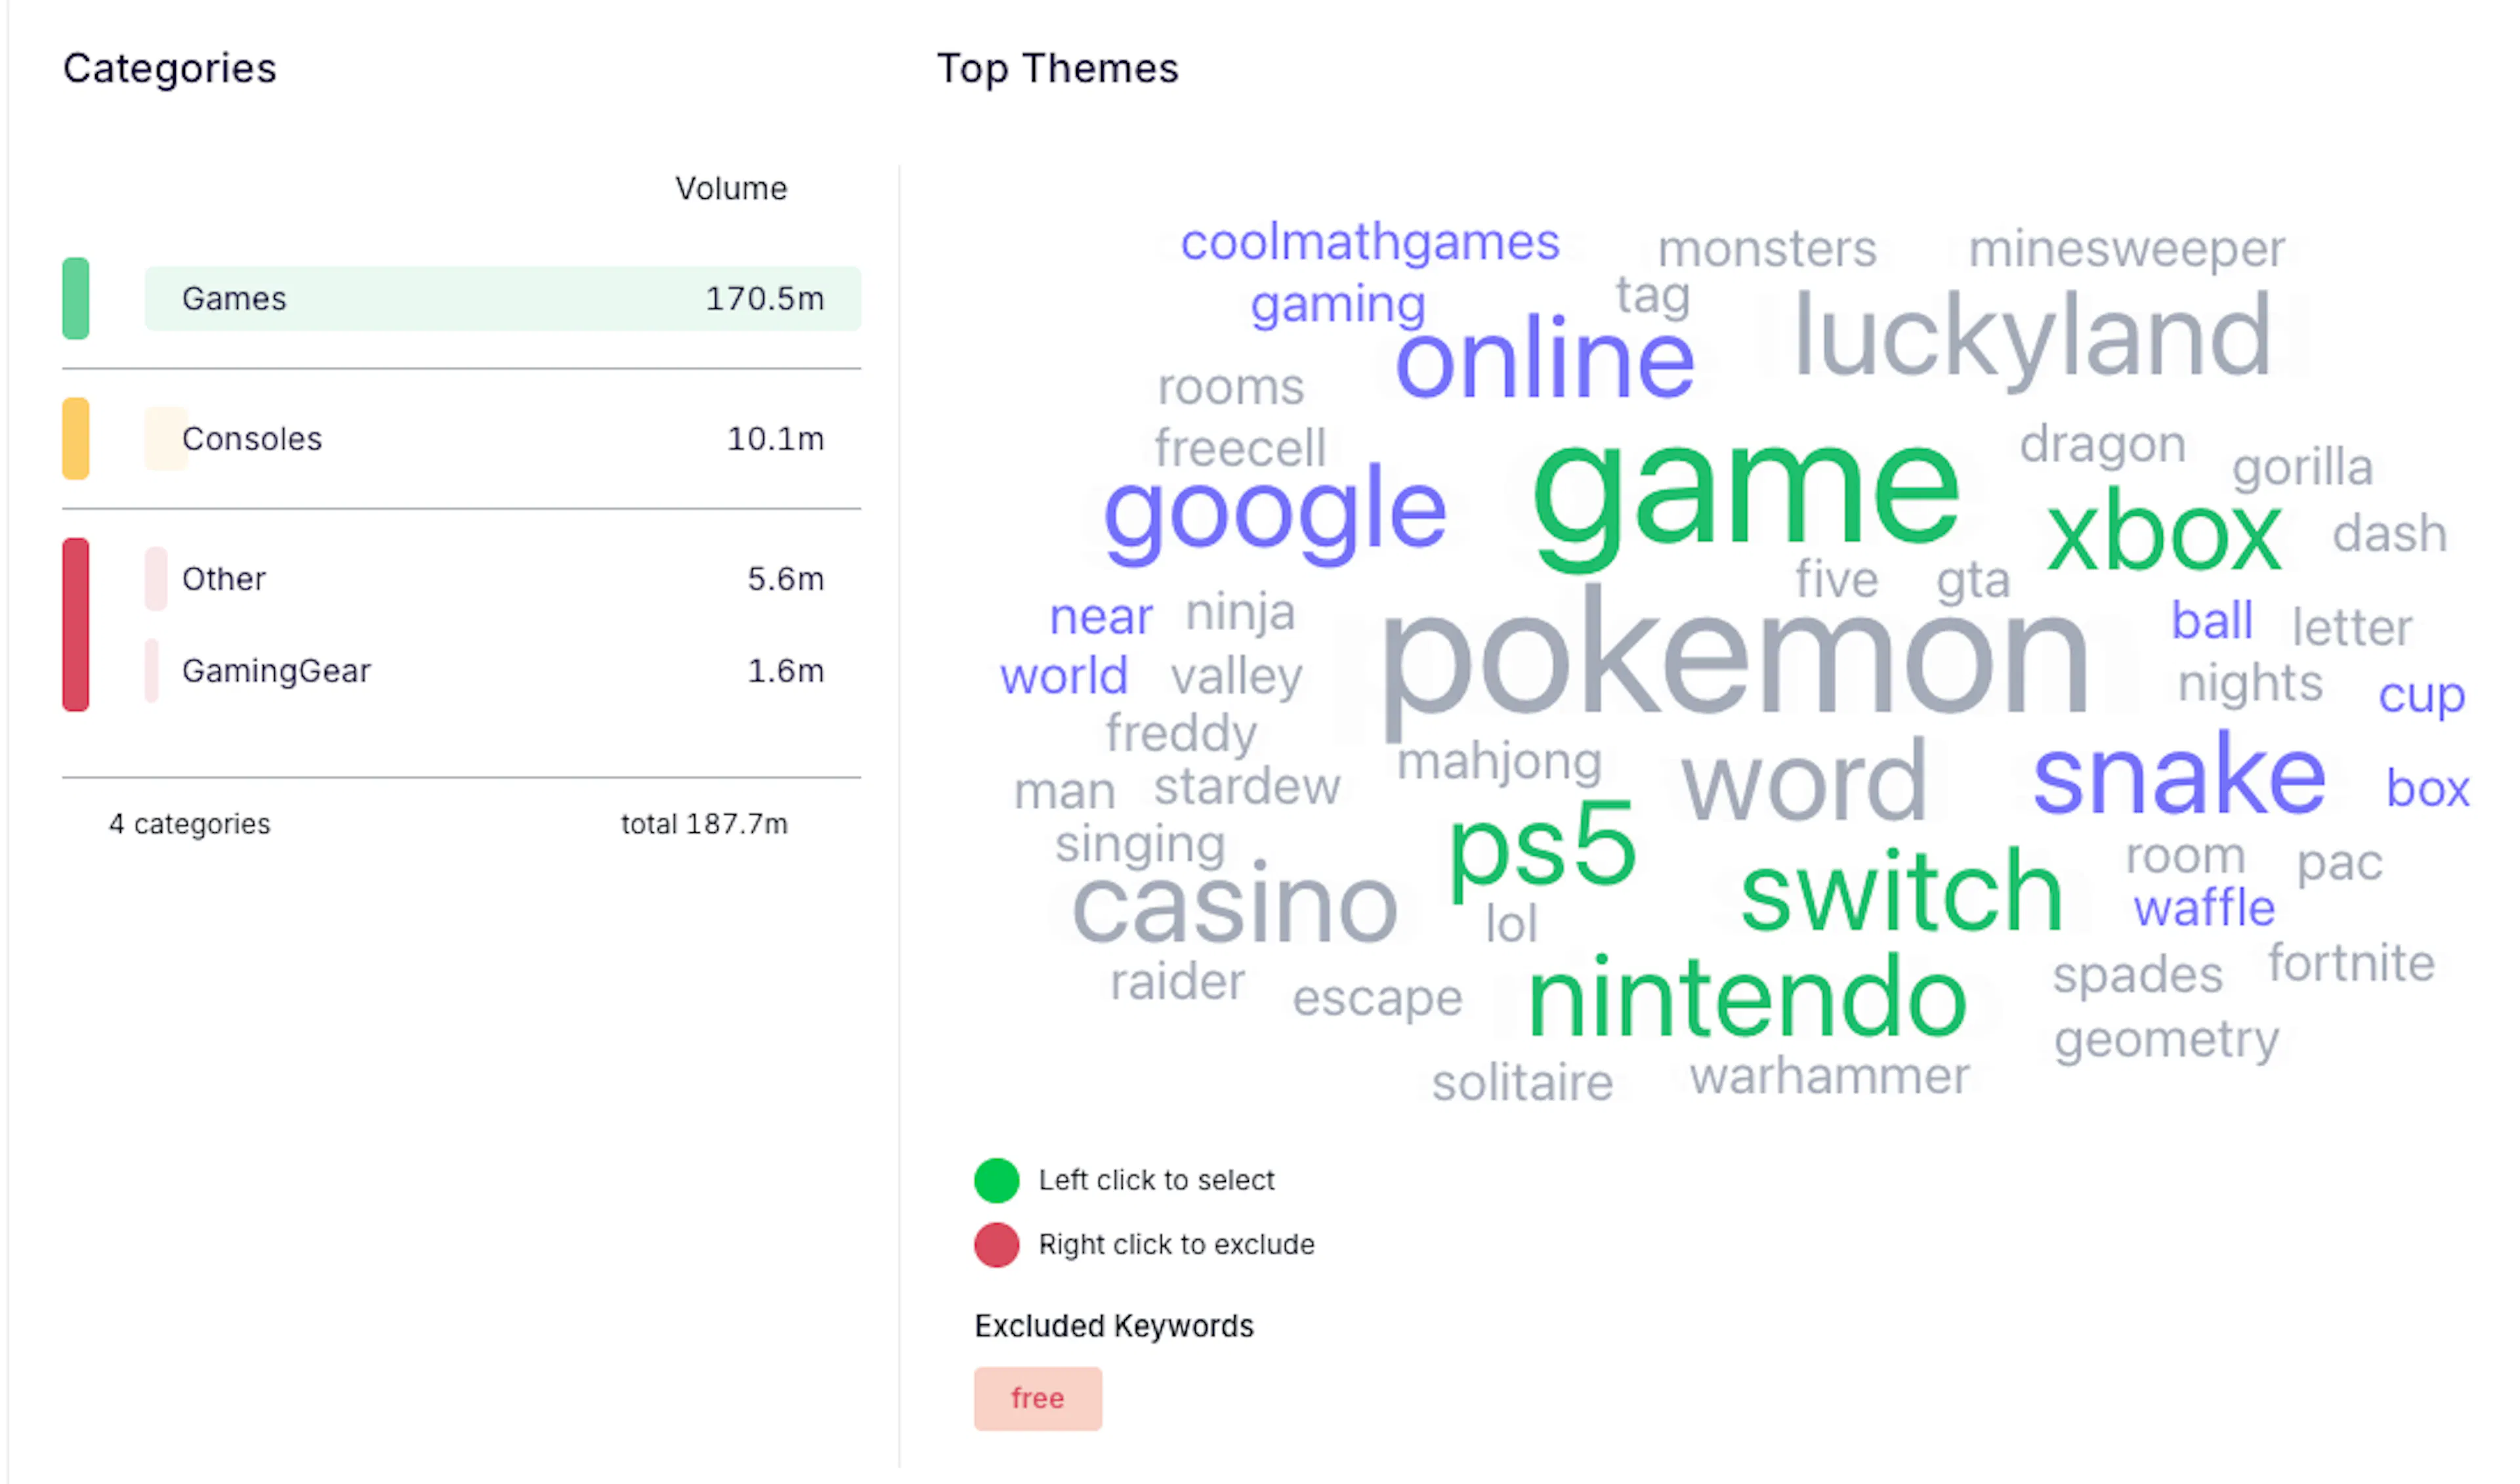
Top Themes renders that same volume as a word cloud, where size means search frequency. The biggest words are usually not surprising (a generic category term like "game" or "pokemon" tends to dominate), but the mid-sized words around them are where the interesting detail lives: specific titles, platforms, and adjacent terms that reveal what people actually associate with your topic once you look past the obvious center of the cloud. Left-click a term to select and drill into it; right-click to exclude it, useful when one dominant word is crowding out everything worth looking at underneath it. Anything you exclude doesn't just disappear quietly, it's tracked in an Excluded Keywords list below the cloud, so you can see exactly what you've filtered out and reconsider it later rather than losing track of your own edits.
The Keyword Table
The most granular card in the report, and the one worth reading last, since it's easiest to interpret once you already understand the funnel and themes above it. Each row is an individual keyword with its own Volume, its Funnel stage, a Correlation with Input score, and a small trendline of its own.
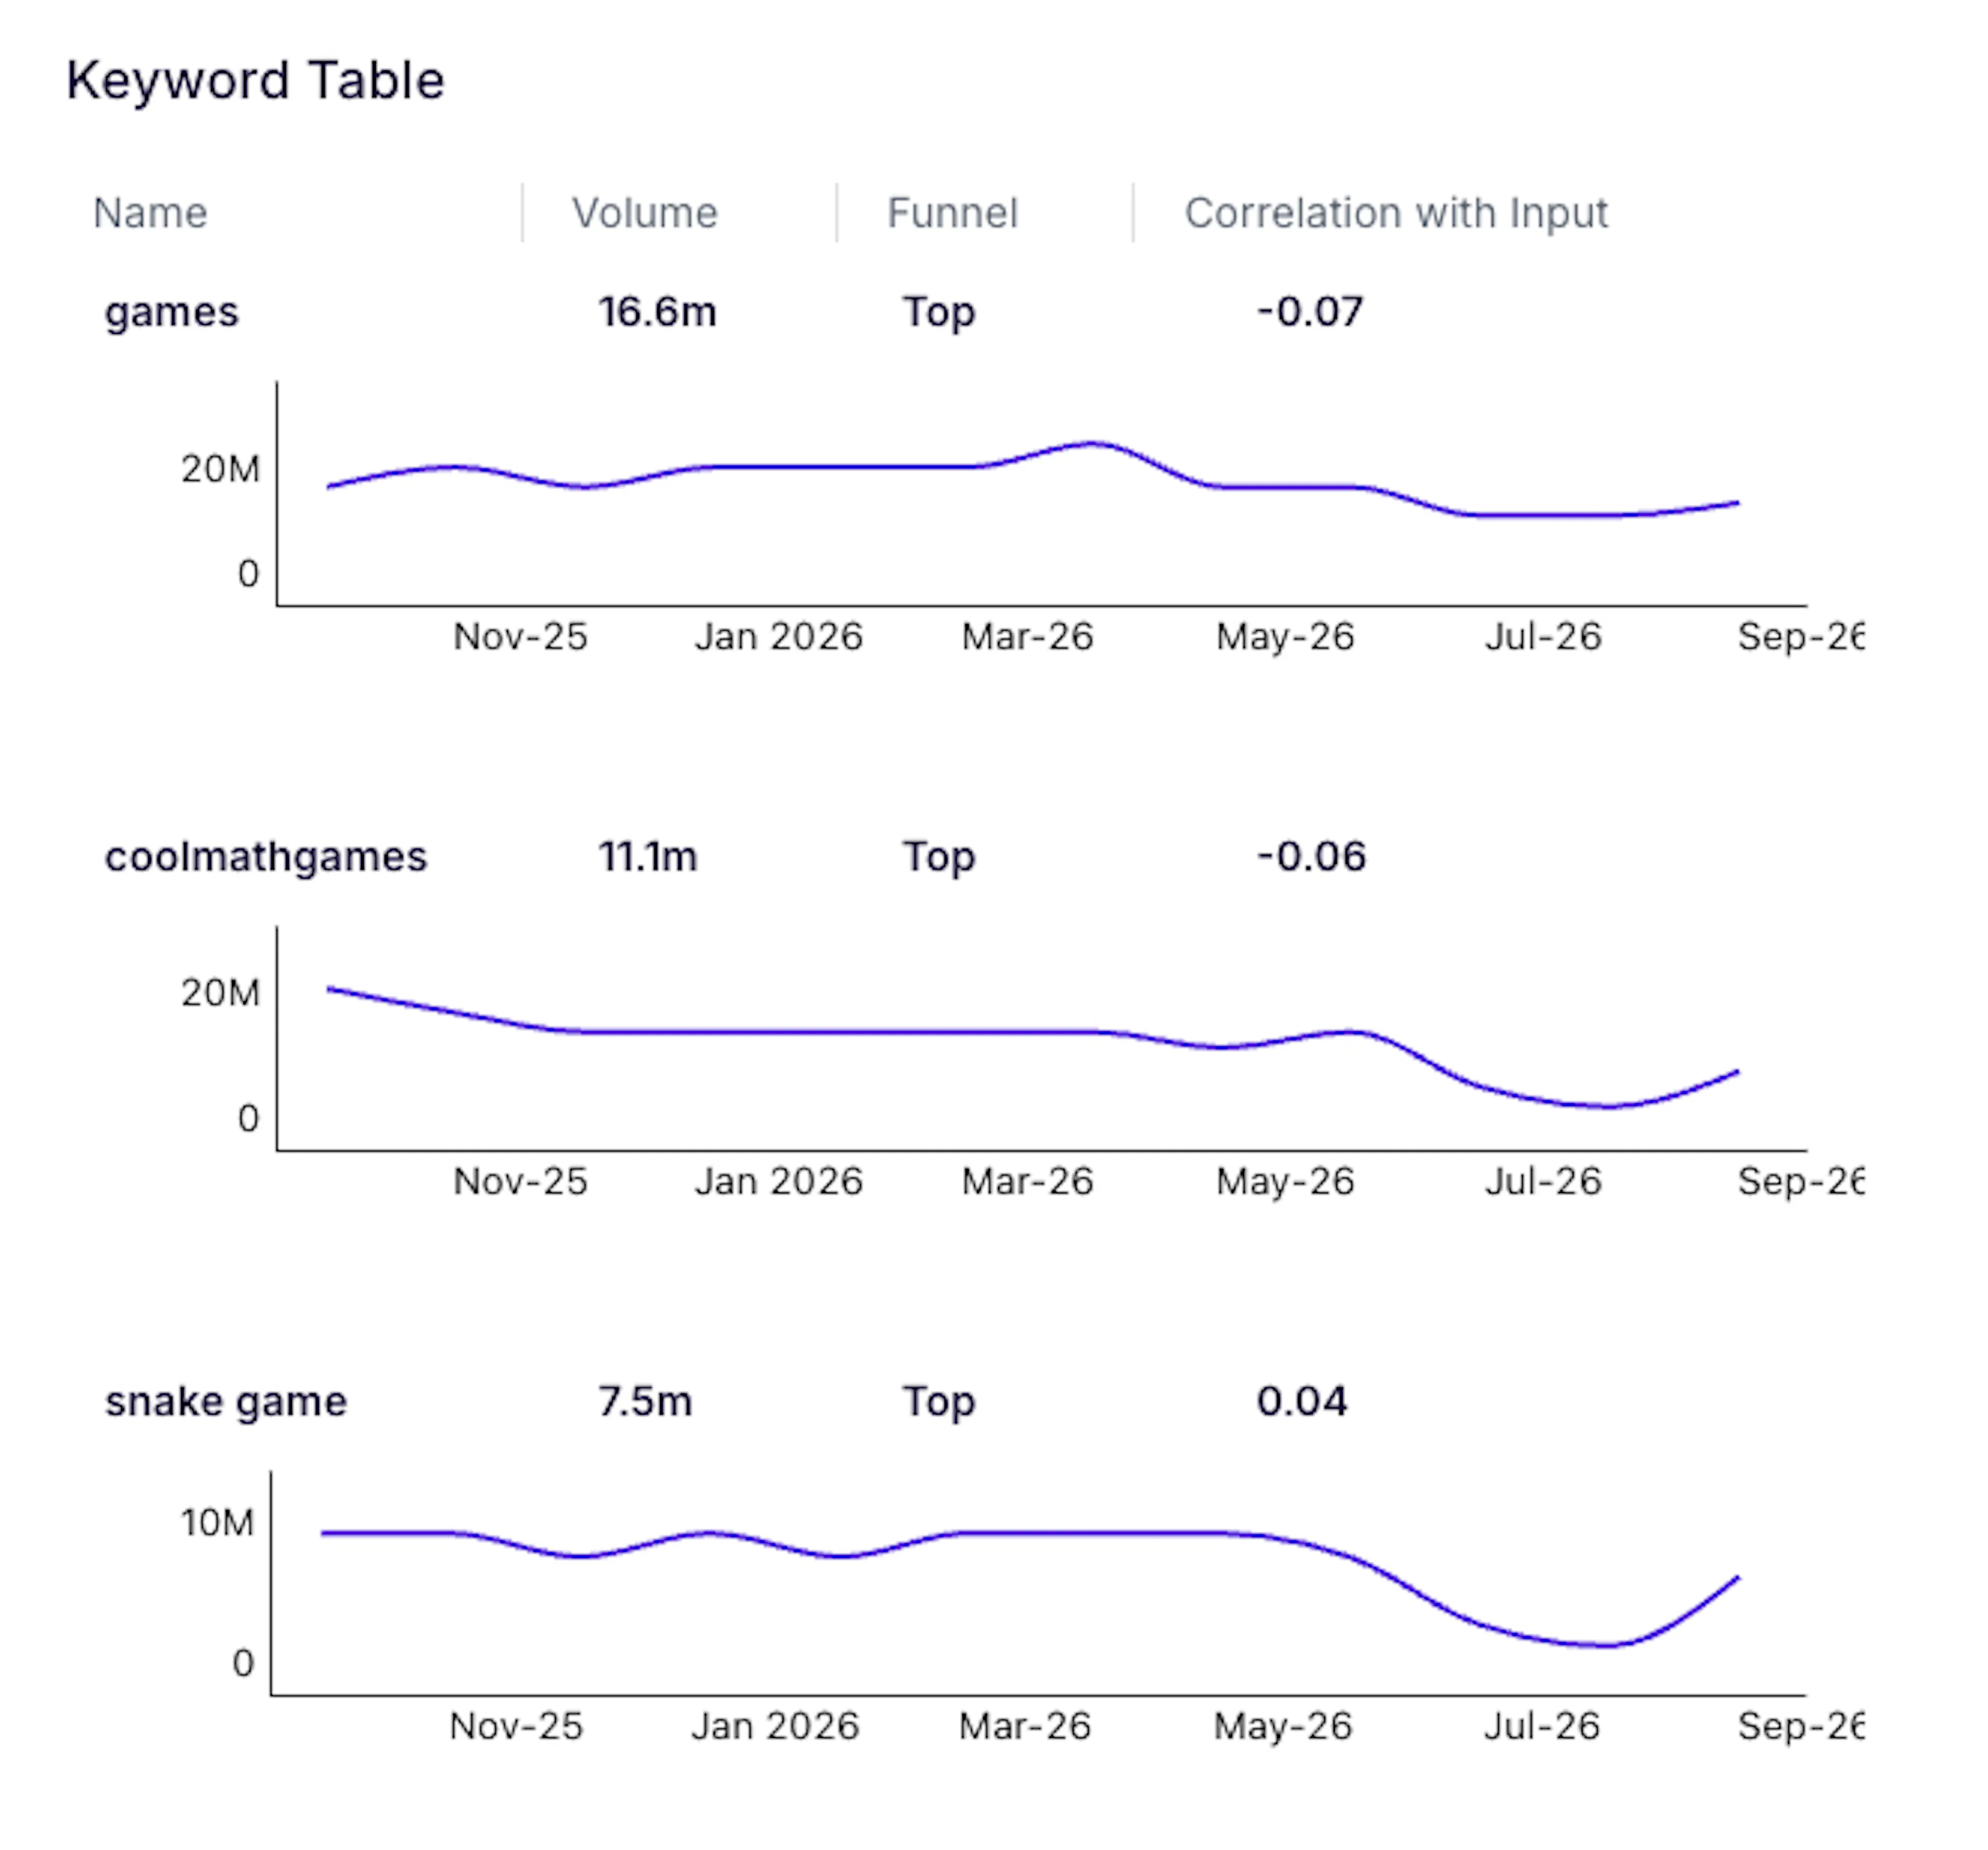
Correlation is the number to pay closest attention to, and it isn't a simple 0-to-1 relevance score, it runs negative as well as positive, because what it's actually measuring is whether a keyword's search volume rises and falls in step with your core keyword's, not merely whether the two are related in meaning. A positive score close to 1 means the two move together almost exactly. A score near 0 means the keyword has a life of its own, rising and falling on its own timeline regardless of what your core keyword is doing. A negative score means the two move in genuine opposition, one tends to rise exactly when the other falls.
In practice, most keywords cluster close to zero. For a topic like "games," related terms such as "coolmathgames" or "snake game" might carry real volume and sit squarely in the Top Funnel, while scoring correlations like -0.06 or 0.04, essentially no meaningful relationship to the core keyword's own rhythm over time. This tells you that these are separate, self-sustaining pockets of demand, ones your core keyword's trend wouldn't have predicted or explained, and often exactly the terms worth a separate line of targeting rather than folding into your main strategy.
What Intent Insight Will Not Tell You
An Intent report describes active demand, not identity or opinion. It will not tell you who this audience is demographically (that's Behavior Insight), or how people already feel about a brand once they've formed an opinion (that's Mentions Insight). An intent report is a snapshot in time, and represents the AI Twin's short-term memory.
Unlike Consumer Behavior and Mentions reports, an Intent report does not support Compare or Schedule Report. Properties is the only tool available in the panel, useful for confirming the topic, category, and market the report was built from.