

A1. Behavior Insight
An AI Twin's persona.
Introduction
Good consumer research starts with a simple act of humility: recognizing that a target audience is made up of real people, and that any label placed on them is, at best, a starting point rather than a finished understanding. A label like "busy parent" or "small business owner" names a population, but it cannot, on its own, hold the individuality of the people inside it, their habits, their context, the life actually being lived behind the demographic. Behavior Insight exists to close that gap between label and lived reality, using audience intelligence to build a fuller, evidence-based picture of who a segment truly is, not by reducing people to a chart, but by giving market researchers, marketers, and product teams a fair likeness to work from.
This is the Behavioral Layer described in IV. Insights & Intelligence: the Who. It maps long-term consumer persona, the demographics, interests, brand affinities, occupations, and lifestyle habits an audience has developed over time, drawn from observed behavioral data rather than from anything an audience member was asked to self-report. That distinction reflects a certain respect for the people being studied: what someone consistently does, without a survey or an interviewer in the room, is often a truer account of who they are than what they might say under the mild pressure of being asked.
These are aggregated audience patterns, not the tracked activity of identifiable individuals, so a prominent signal describes the group and its tendencies, not a guarantee about any one person inside it. When Behavior Intelligence feeds an AI Twin's creation, this same context becomes the Twin's Persona: the long-term foundation it draws on every time it later speaks during Intent or Mentions-informed research.
Why Behavior Intelligence Matters
Knowing that a person belongs to an audience is different from understanding the world around that audience. Two groups may both be interested in the same product category but differ in their wider interests, preferred brands, activities, professional roles, locations, or levels of experience. These differences can change how a research question should be framed, which comparisons are meaningful, and what messages or concepts should be explored. Behavior Intelligence provides this context before direct research begins and can help teams:
- develop a richer understanding of a consumer or professional audience
- identify characteristics that may distinguish the audience from the population
- generate hypotheses for Quantitative and Qualitative Research
- select useful variables and subgroups for later studies
- find themes for messaging, content, partnerships, product development, or media planning
The report is a foundation for research. It identifies patterns worth examining, after which Quantitative Research can test how widely those patterns hold, and Qualitative Research can investigate why they matter.
First-Party and Third-Party Audiences
Every Behavior report starts from an audience, and that audience arrives by one of two routes.
A first-party audience comes from an organization's own customer or audience relationships, often through a connected website pixel or another customer-based audience on a supported platform. consumr.ai works with the anonymized and aggregated signals that connection makes available, never with names or personally identifiable information. This route keeps the research anchored to a group the organization already knows: purchasers, subscribers, site visitors, high-value customers.
A third-party audience is a curated dataset built by external data intelligence companies, organized around interests, behaviors, characteristics, or life stages. It gives you a starting population when no suitable first-party audience exists internally. A similar-sounding segment name is not a guarantee of similar construction, so the definition behind a third-party segment is worth reviewing before you build on it.
Understanding a Consumer Behavior Report
Two Ways to Read the Same Audience
A Behavior report is available through all four routes described in IV. Insights & Intelligence: Online, Pro, E-tail, and Research Setup. For Behavior specifically, the Online and Pro versions carry their own names and cover genuinely different ground.
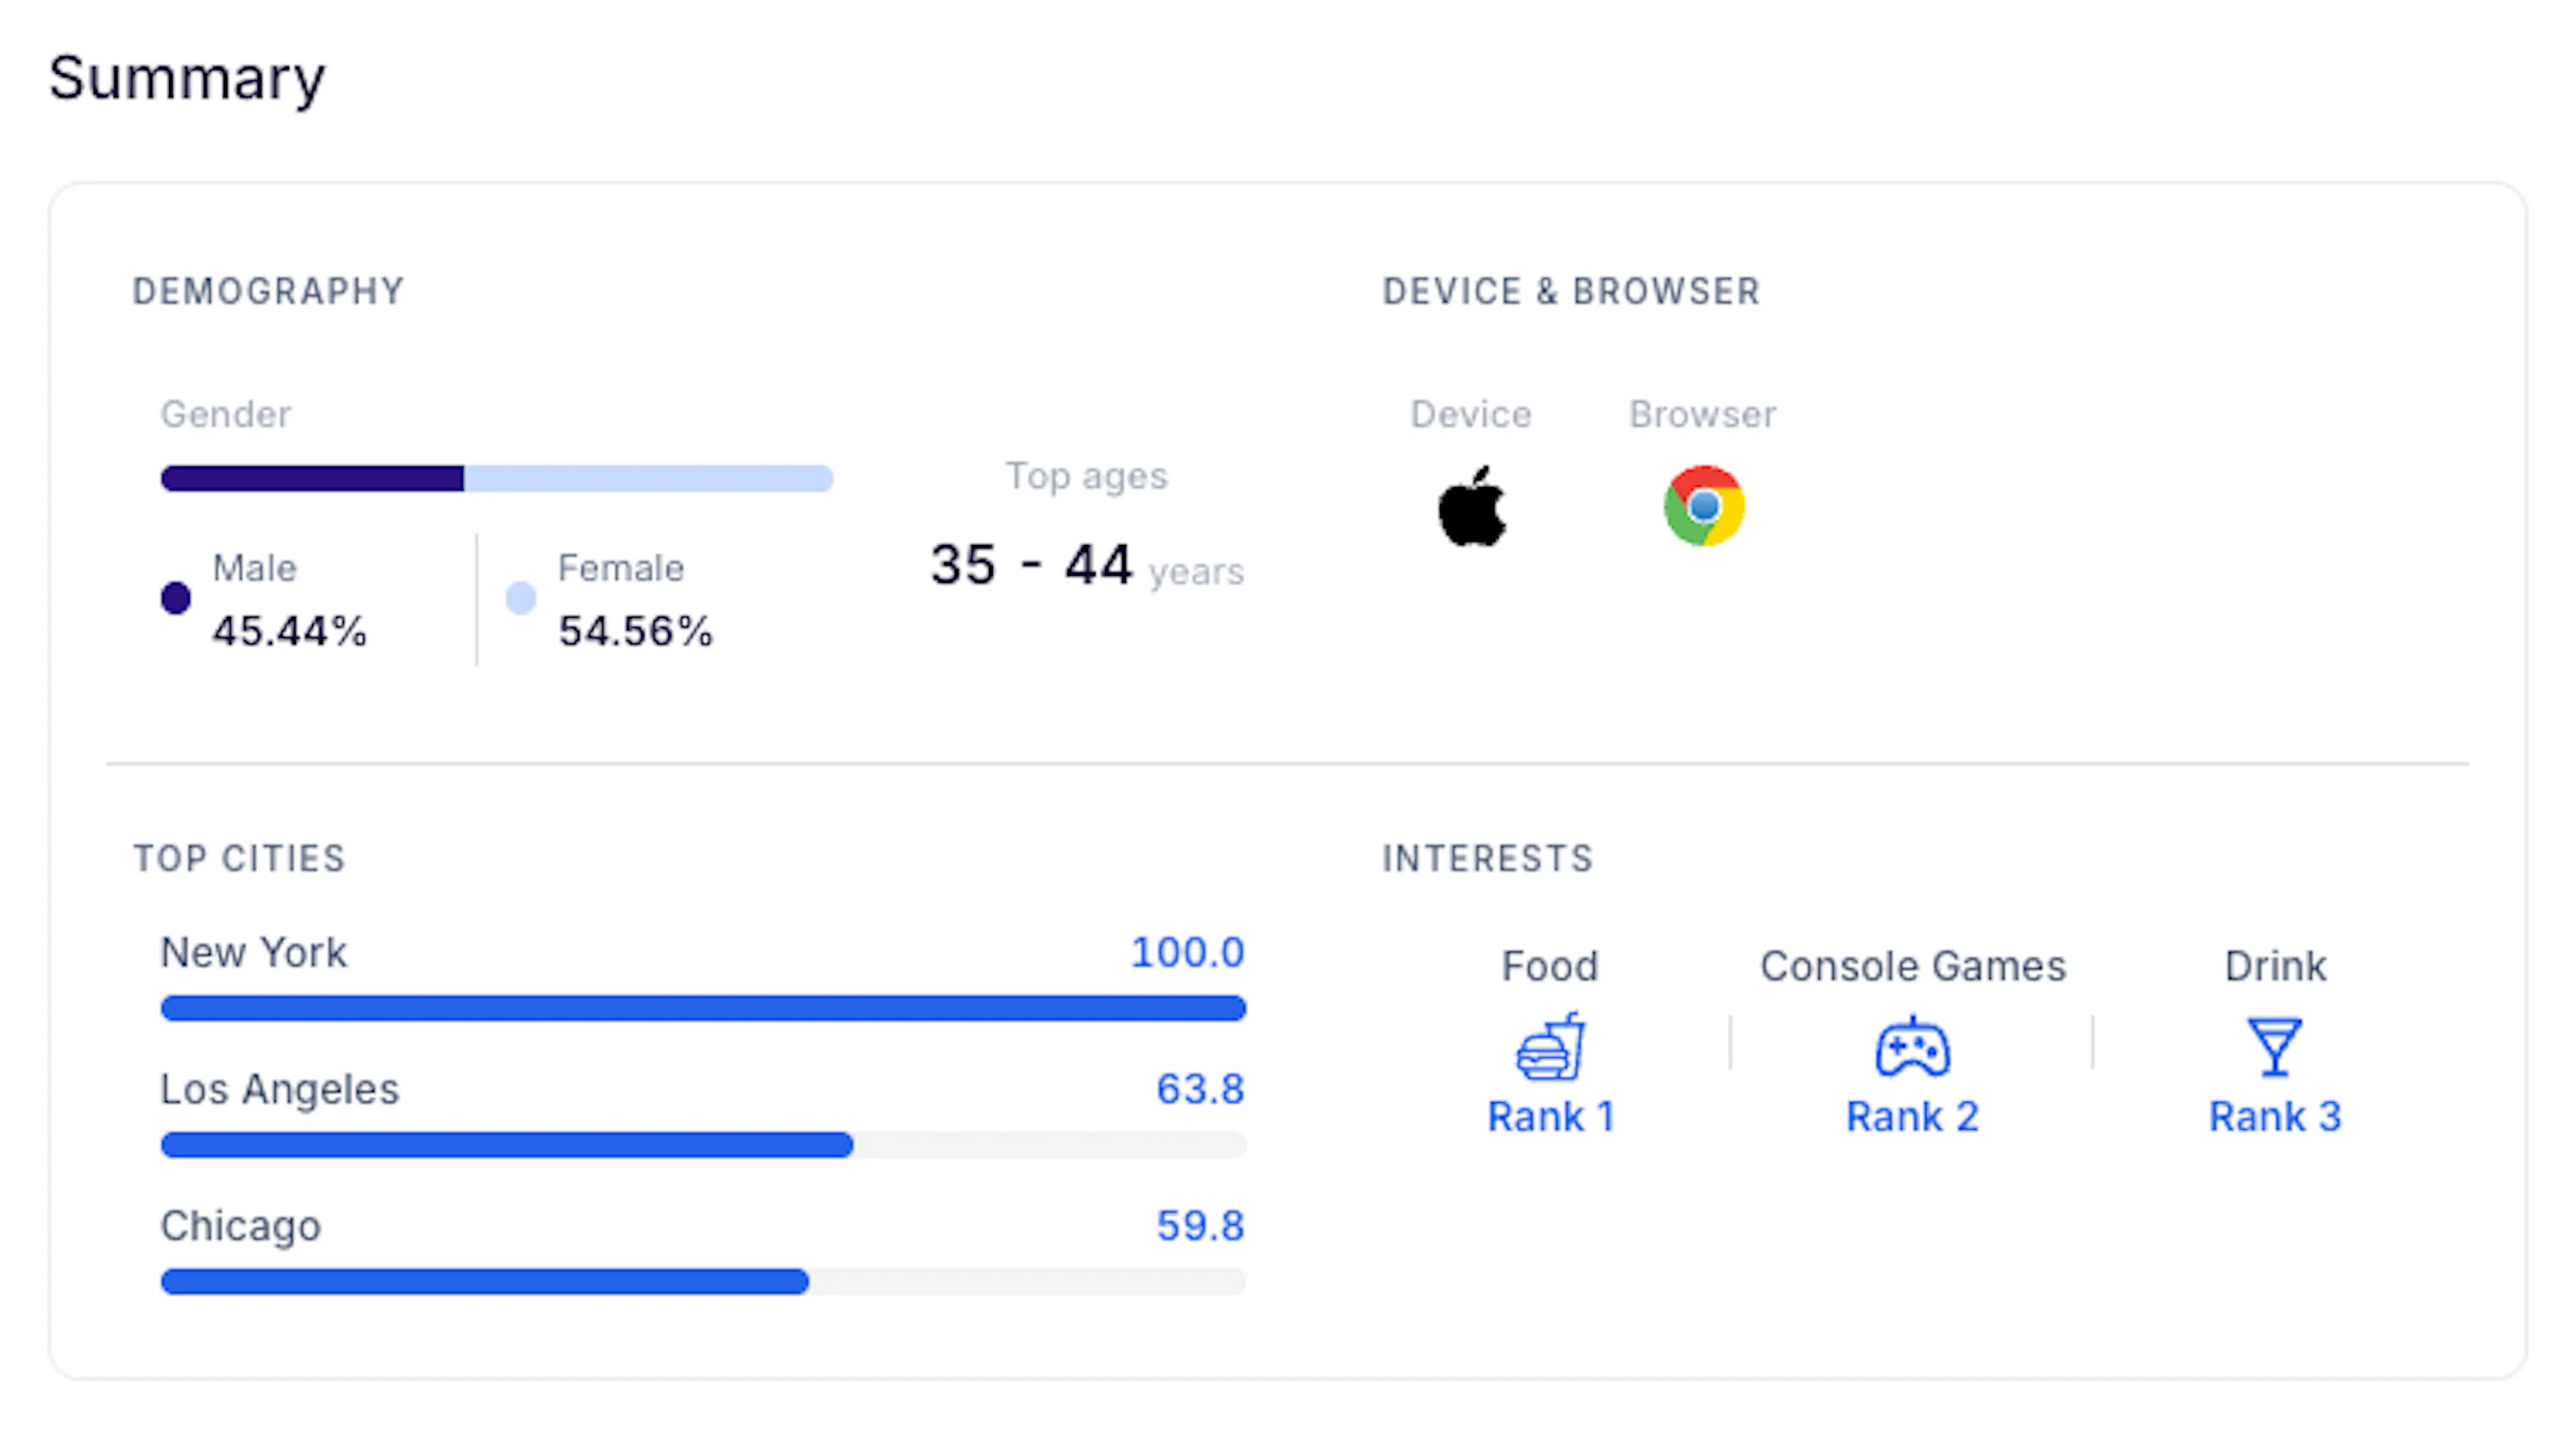
Consumer Behavior, the Online version, describes an audience as consumers and participants in everyday life: demographic, geographic, interest, brand, device, work, activity, trait, education, and place-based signals.
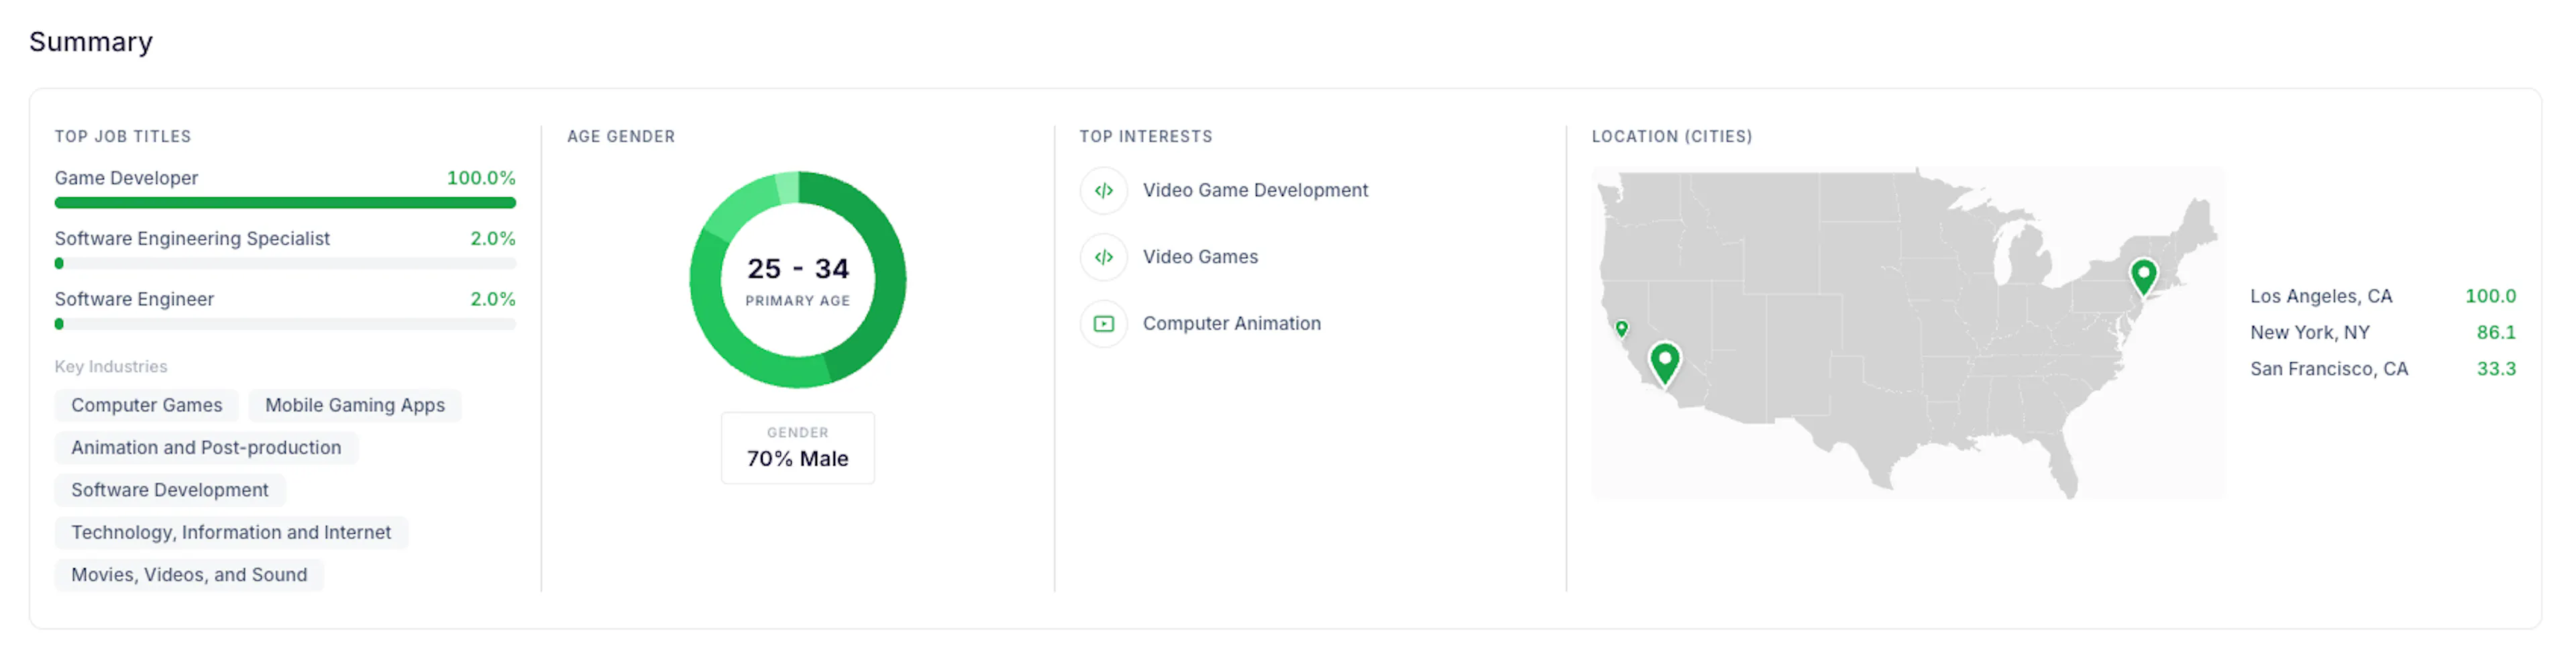
Professional Behavior, the Pro version, describes the same kind of audience through work instead: industries, job functions, seniority, skills, organization size, titles, and years of experience, alongside age, gender, and cities. Consumer Behavior and Professional Behavior are not two views of one report; they answer different questions about the same population.
Cards Common to Every Behavior Report
Audience Summary opens the report with an orientation, not a conclusion: gender split, leading age group, top cities, top interests or titles, and device and browser context. Treat it as a first impression, not a complete definition.
Age and Gender shows the full distribution across brackets, not just the largest one. A leading age range describes the core of the audience, but a secondary bracket can still represent a real opportunity.
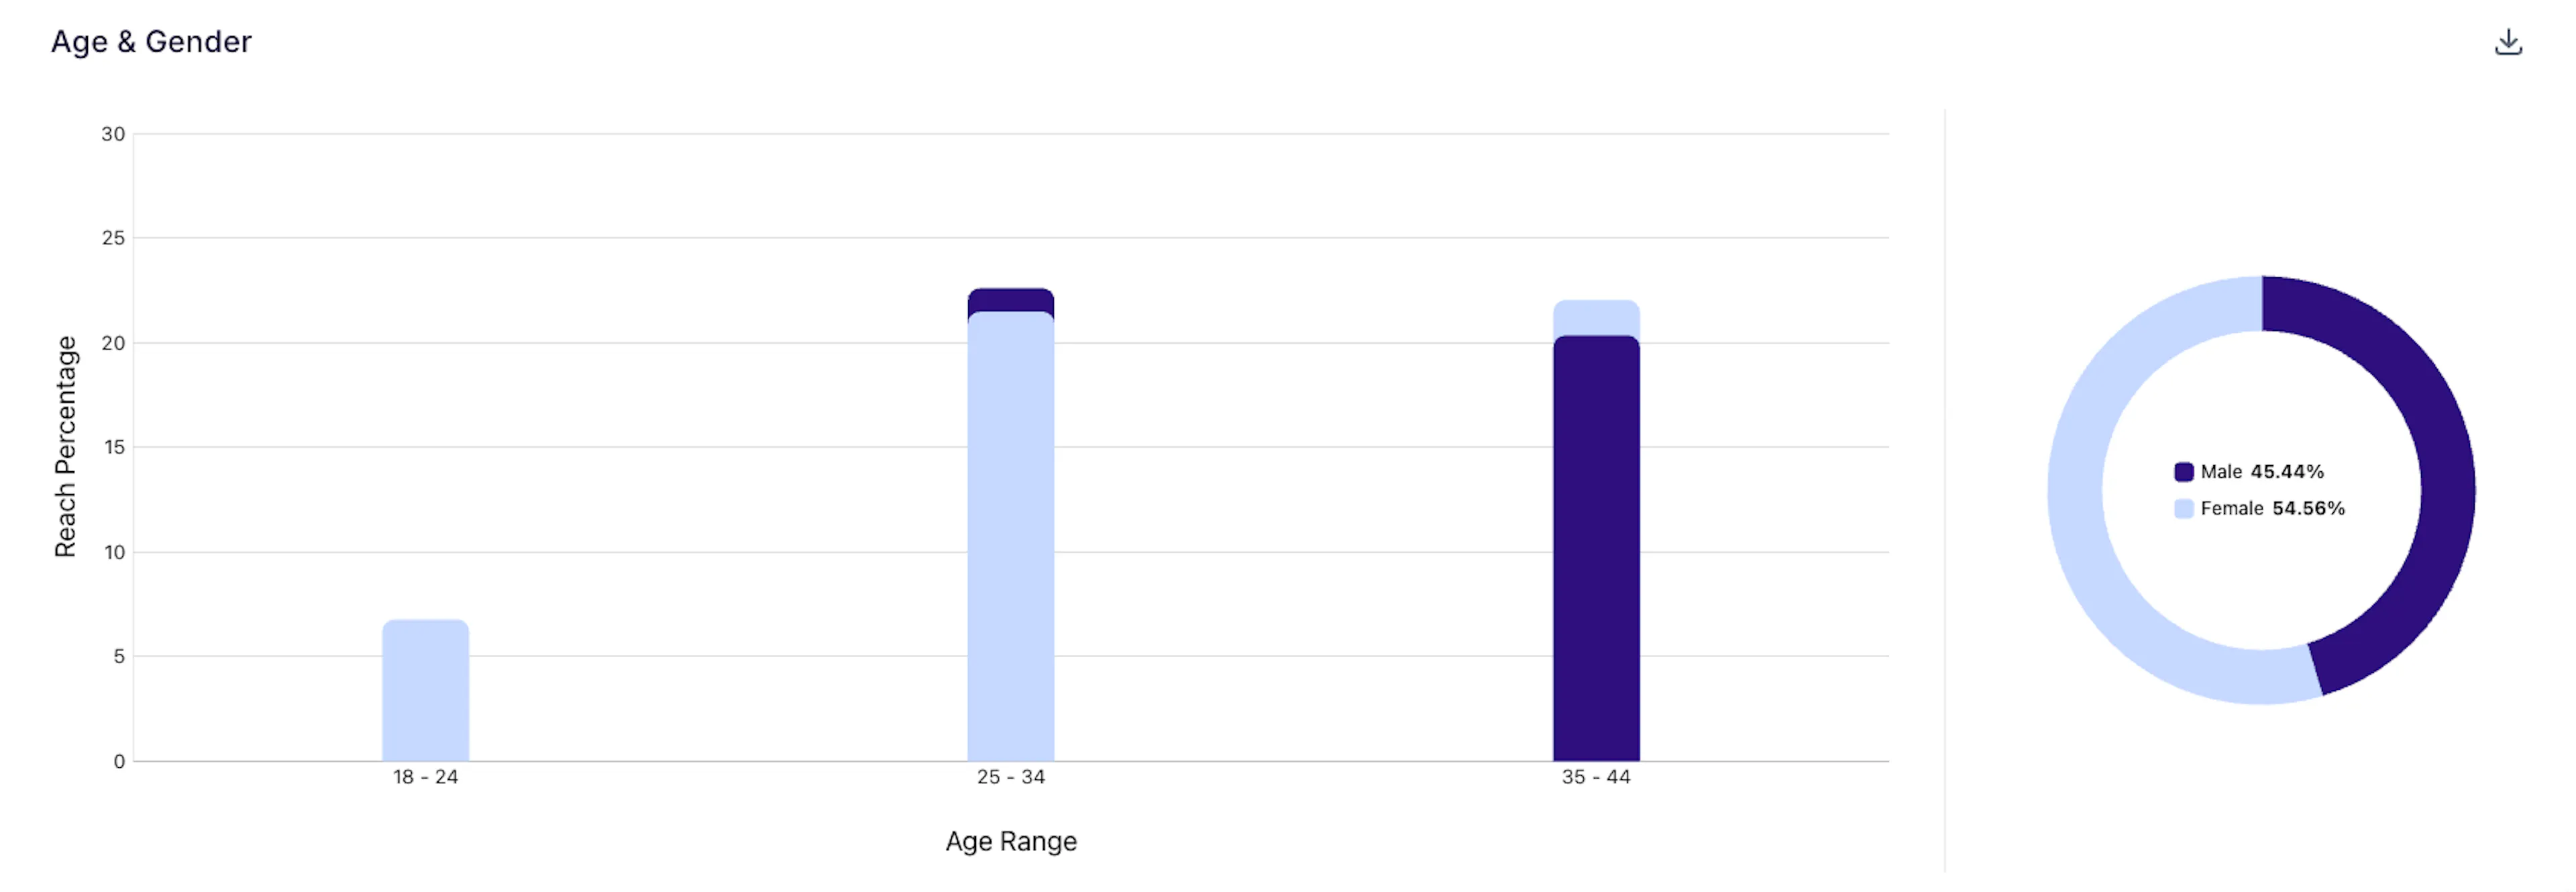
An audience skewing 54.56% female to 45.44% male might look close to even overall, but the age breakdown can tell a sharper story: the 25-34 bracket might be dominated by women, while 35-44 flips to a male-led bracket instead. A single "the audience is mostly female" headline would miss that reversal entirely, and it's exactly the kind of detail that changes how you'd message to a 25-year-old versus a 40-year-old inside the same audience.
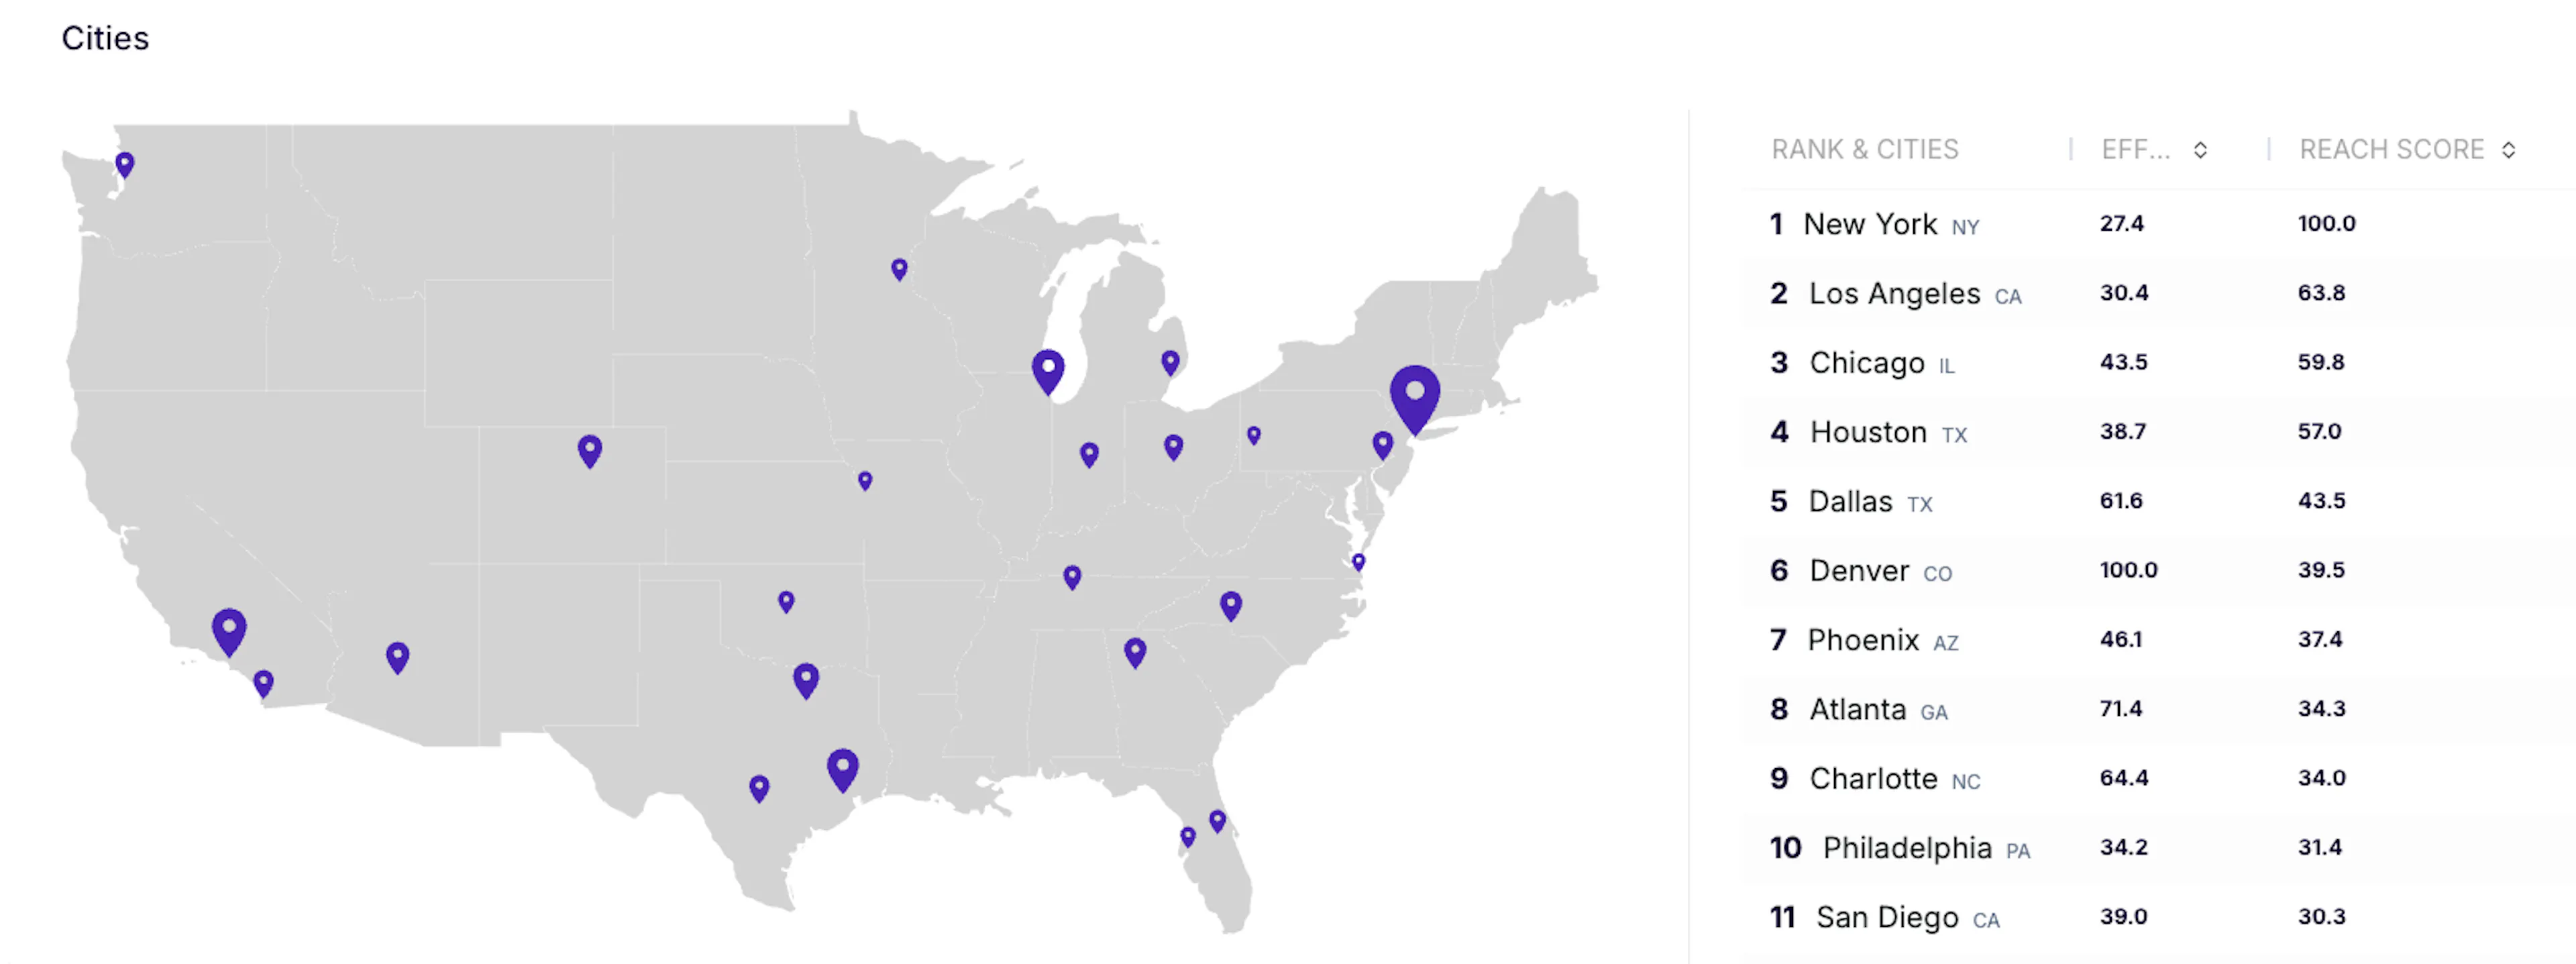
Cities ranks locations by both Reach and Efficiency, and the two rarely agree, which is exactly where the useful information sits. A large market like New York or Los Angeles tends to lead on Reach simply by virtue of being large. But a city like Houston or Indianapolis can post a near-perfect Efficiency score while sitting far down the Reach list, meaning the audience isn't especially large there, but relative to the city's own size, it shows up in unusually high concentration. Reach tells you where the volume is. Efficiency tells you where the audience punches above its weight, which matters for a broad media buy far less than it matters for a tightly targeted local push.
Many cards in a Behavior report lean on three measures.
- Reach shows how strongly a characteristic or location is represented within the audience: a higher score means the signal applies to a larger, more prominent share of the group.
- Efficiency shows where an audience, location, or theme is comparatively strong, which is not always the same as where it is largest; a smaller signal can still be an efficient one.
- Uniqueness shows how distinctive a signal is to this audience relative to the comparison population, so a characteristic can carry high Reach and low Uniqueness at once, common in both the audience and the wider population alike.
Read the three together, because each one is answering a different question. Reach tells you about scale: how much of the audience a signal touches. Efficiency and Uniqueness tell you about differentiation: whether that signal actually says something distinctive about this audience, or just reflects how common it is everywhere. A large signal is not automatically a distinctive one, and a distinctive signal is not automatically large enough to build a broad strategy on.
The Interest Matrix plots signals by Reach Score against Uniqueness Score across four areas, and the split is really a question about what kind of attention you're trying to earn.
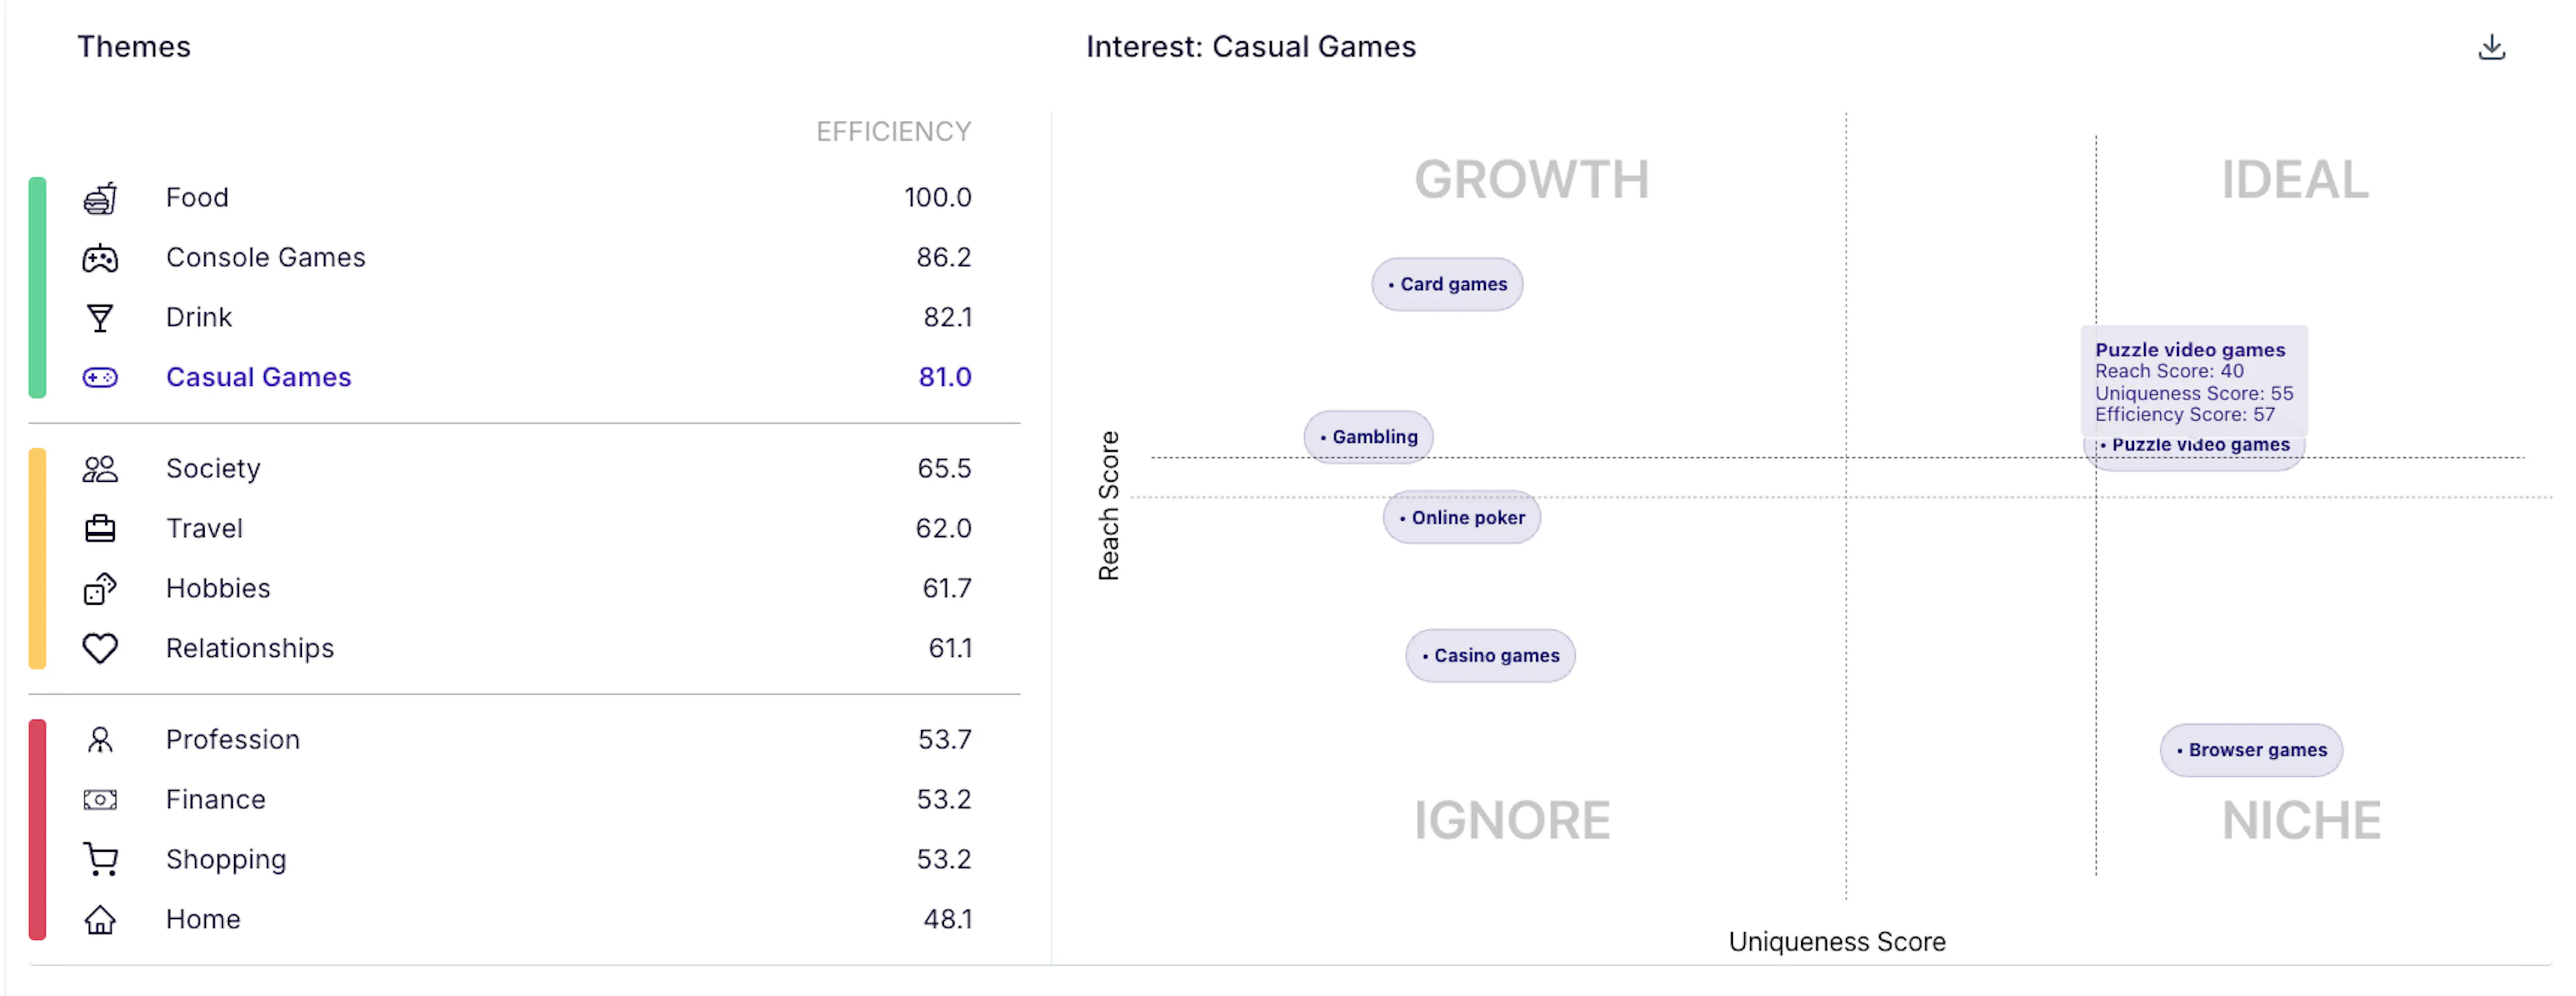
- Ideal combines strong Reach with strong Uniqueness, the rare case where you reach a lot of people and say something that is genuinely theirs.
- Growth carries strong Reach but lower Uniqueness, good for building awareness where breadth matters more than distinction.
- Niche is lower on Reach but stands out on Uniqueness, smaller, but often more persuasive to the people it does reach.
- Ignore is currently weaker on both, relative to the rest, and that word "currently" is doing real work: the ranking is relative, not permanent, and something sitting here today can move once the research question or the population itself shifts.
Predicting behavior with certainty is genuinely hard, and no platform can promise otherwise honestly. What this matrix offers instead is a sharper way to weigh probability than a guess.
What's Unique to Online Behavior Report
- Brands They Consider: the brands surrounding the audience's wider consideration landscape. Consideration is not confirmed purchase or loyalty. The list itself is often the insight: a set spanning Dunkin' Donuts, Starbucks, Burger King, Domino's, and McDonald's alongside Peloton, SoulCycle, and Whole Foods describes an audience holding both convenience-driven quick service restaurant habits and premium health-and-fitness aspirations at once, a genuinely dual identity.

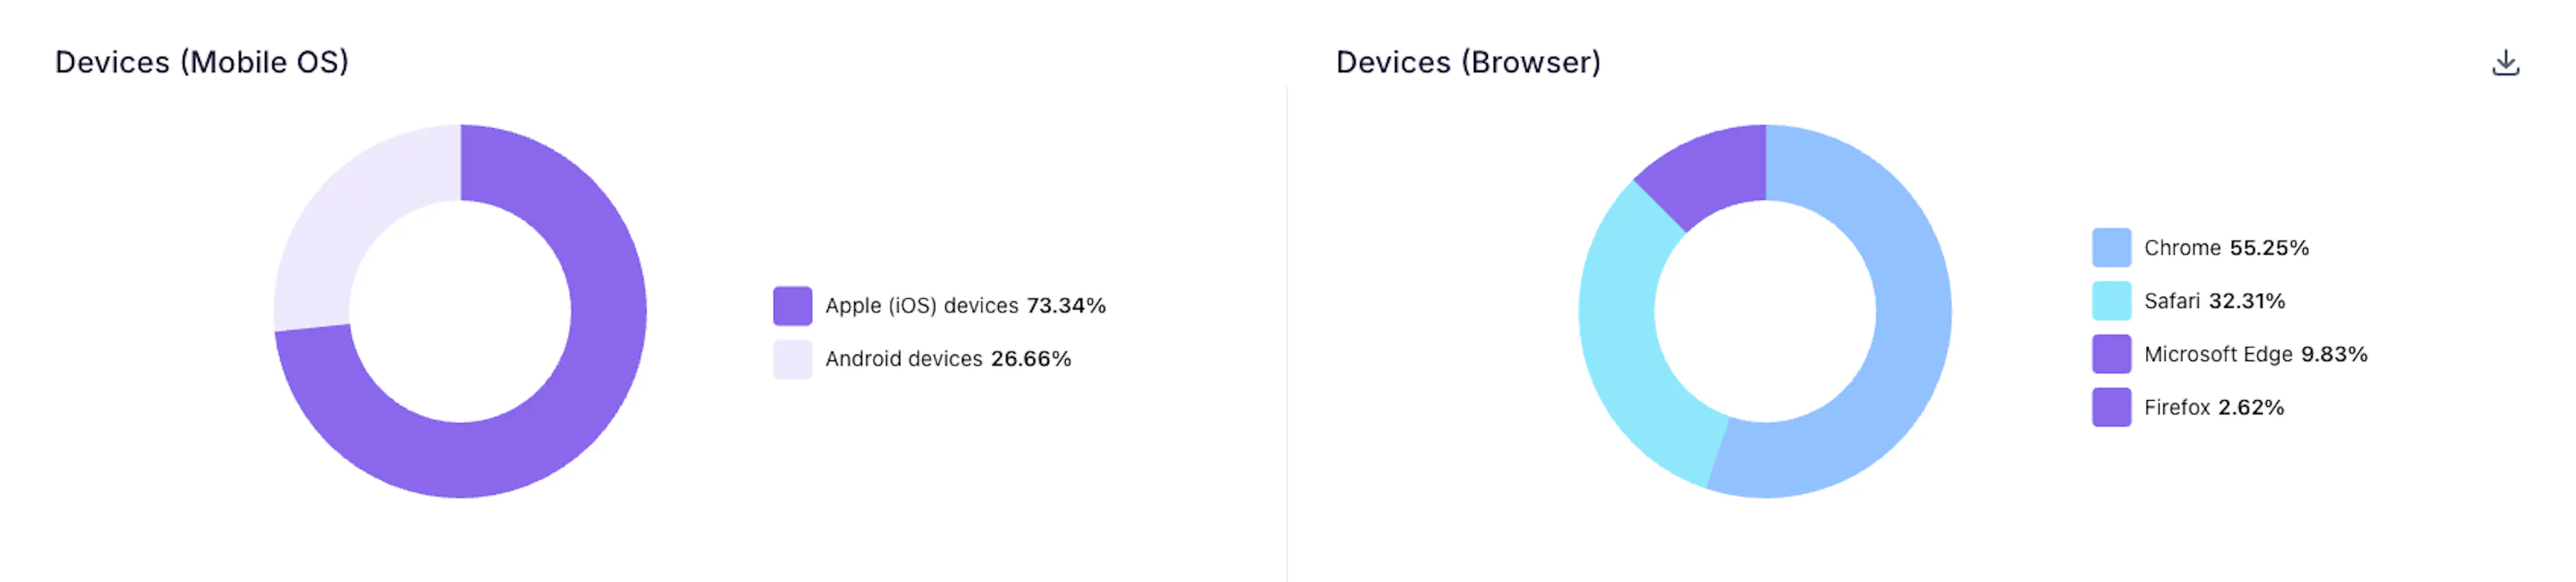
- Devices (Mobile OS & Browser): operating systems and browsers associated with the audience, read within the selected market rather than across markets. An audience running 73.34% Apple to 26.66% Android, with Chrome leading at 55.25% ahead of Safari's 32.31%, is skewing more heavily toward iOS than the U.S. market typically does, itself a signal worth noting about who this audience is.
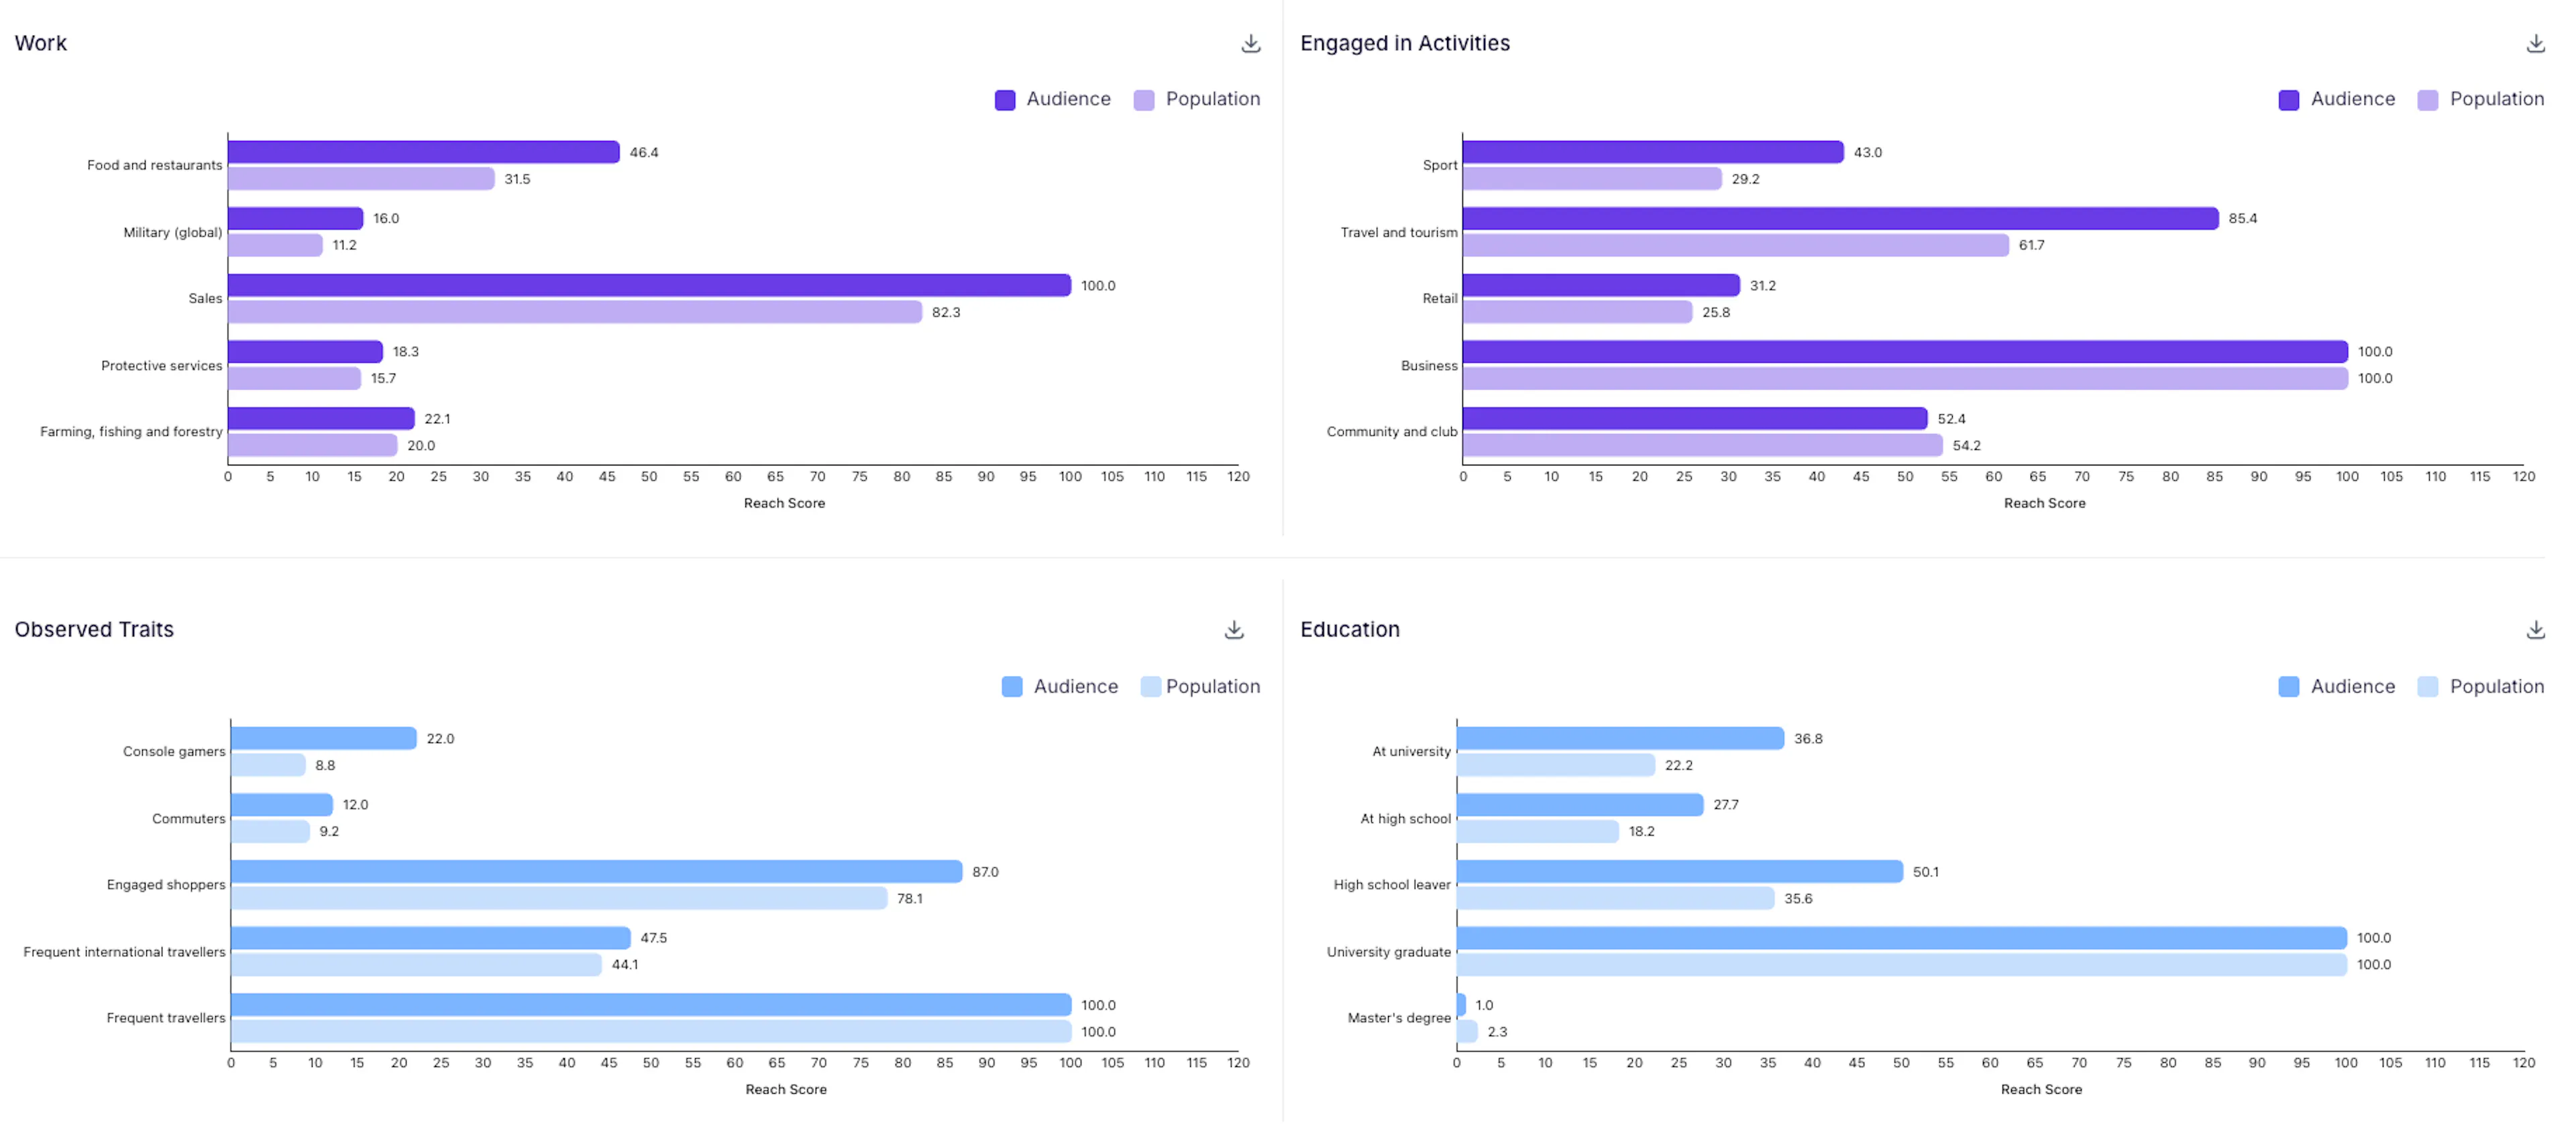
- Work, Engaged in Activities, Observed Traits, and Education: four comparative charts setting the audience against the wider population. In each, the gap between audience and population is the signal worth reading.
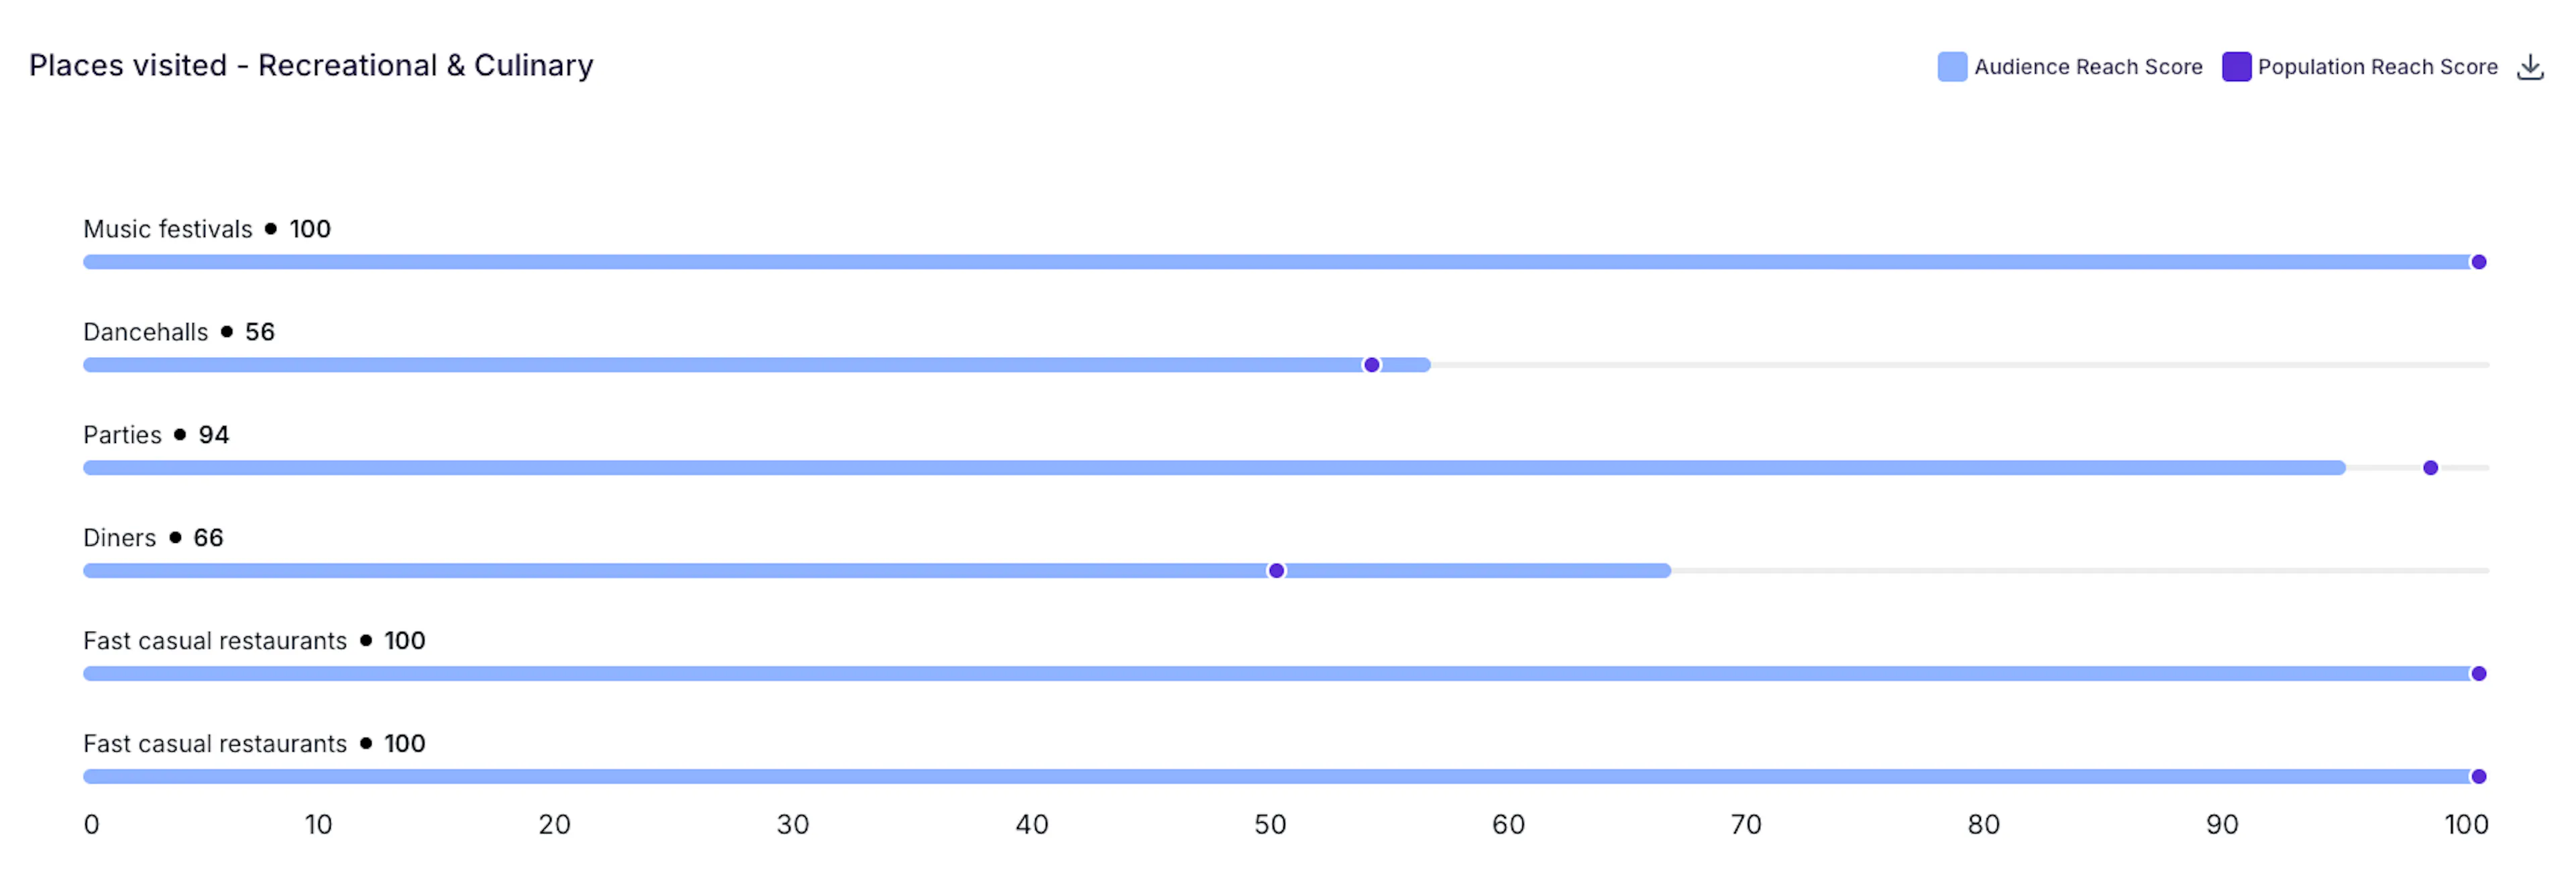
- Places Visited: Recreational and Culinary compares the audience's association with venue types against the general population, and the size of the gap, not just its direction, is where the real detail lives. Fast casual restaurants might hit 100 for both audience and population at once, a shared ceiling with no distinctive gap at all. Parties might score 94 for the audience against 97 for the population, a small but real underweight, this audience is slightly less into parties than average, despite the number still looking high on its own. For diners: an audience score of 66 against a population score closer to 50, this audience gravitates toward diners meaningfully more than the general population does. The read isn't whether a score is high. It's whether the audience sits ahead of, behind, or tied with the baseline at that same place, and by how much.
What's Unique to Professional Behavior Report
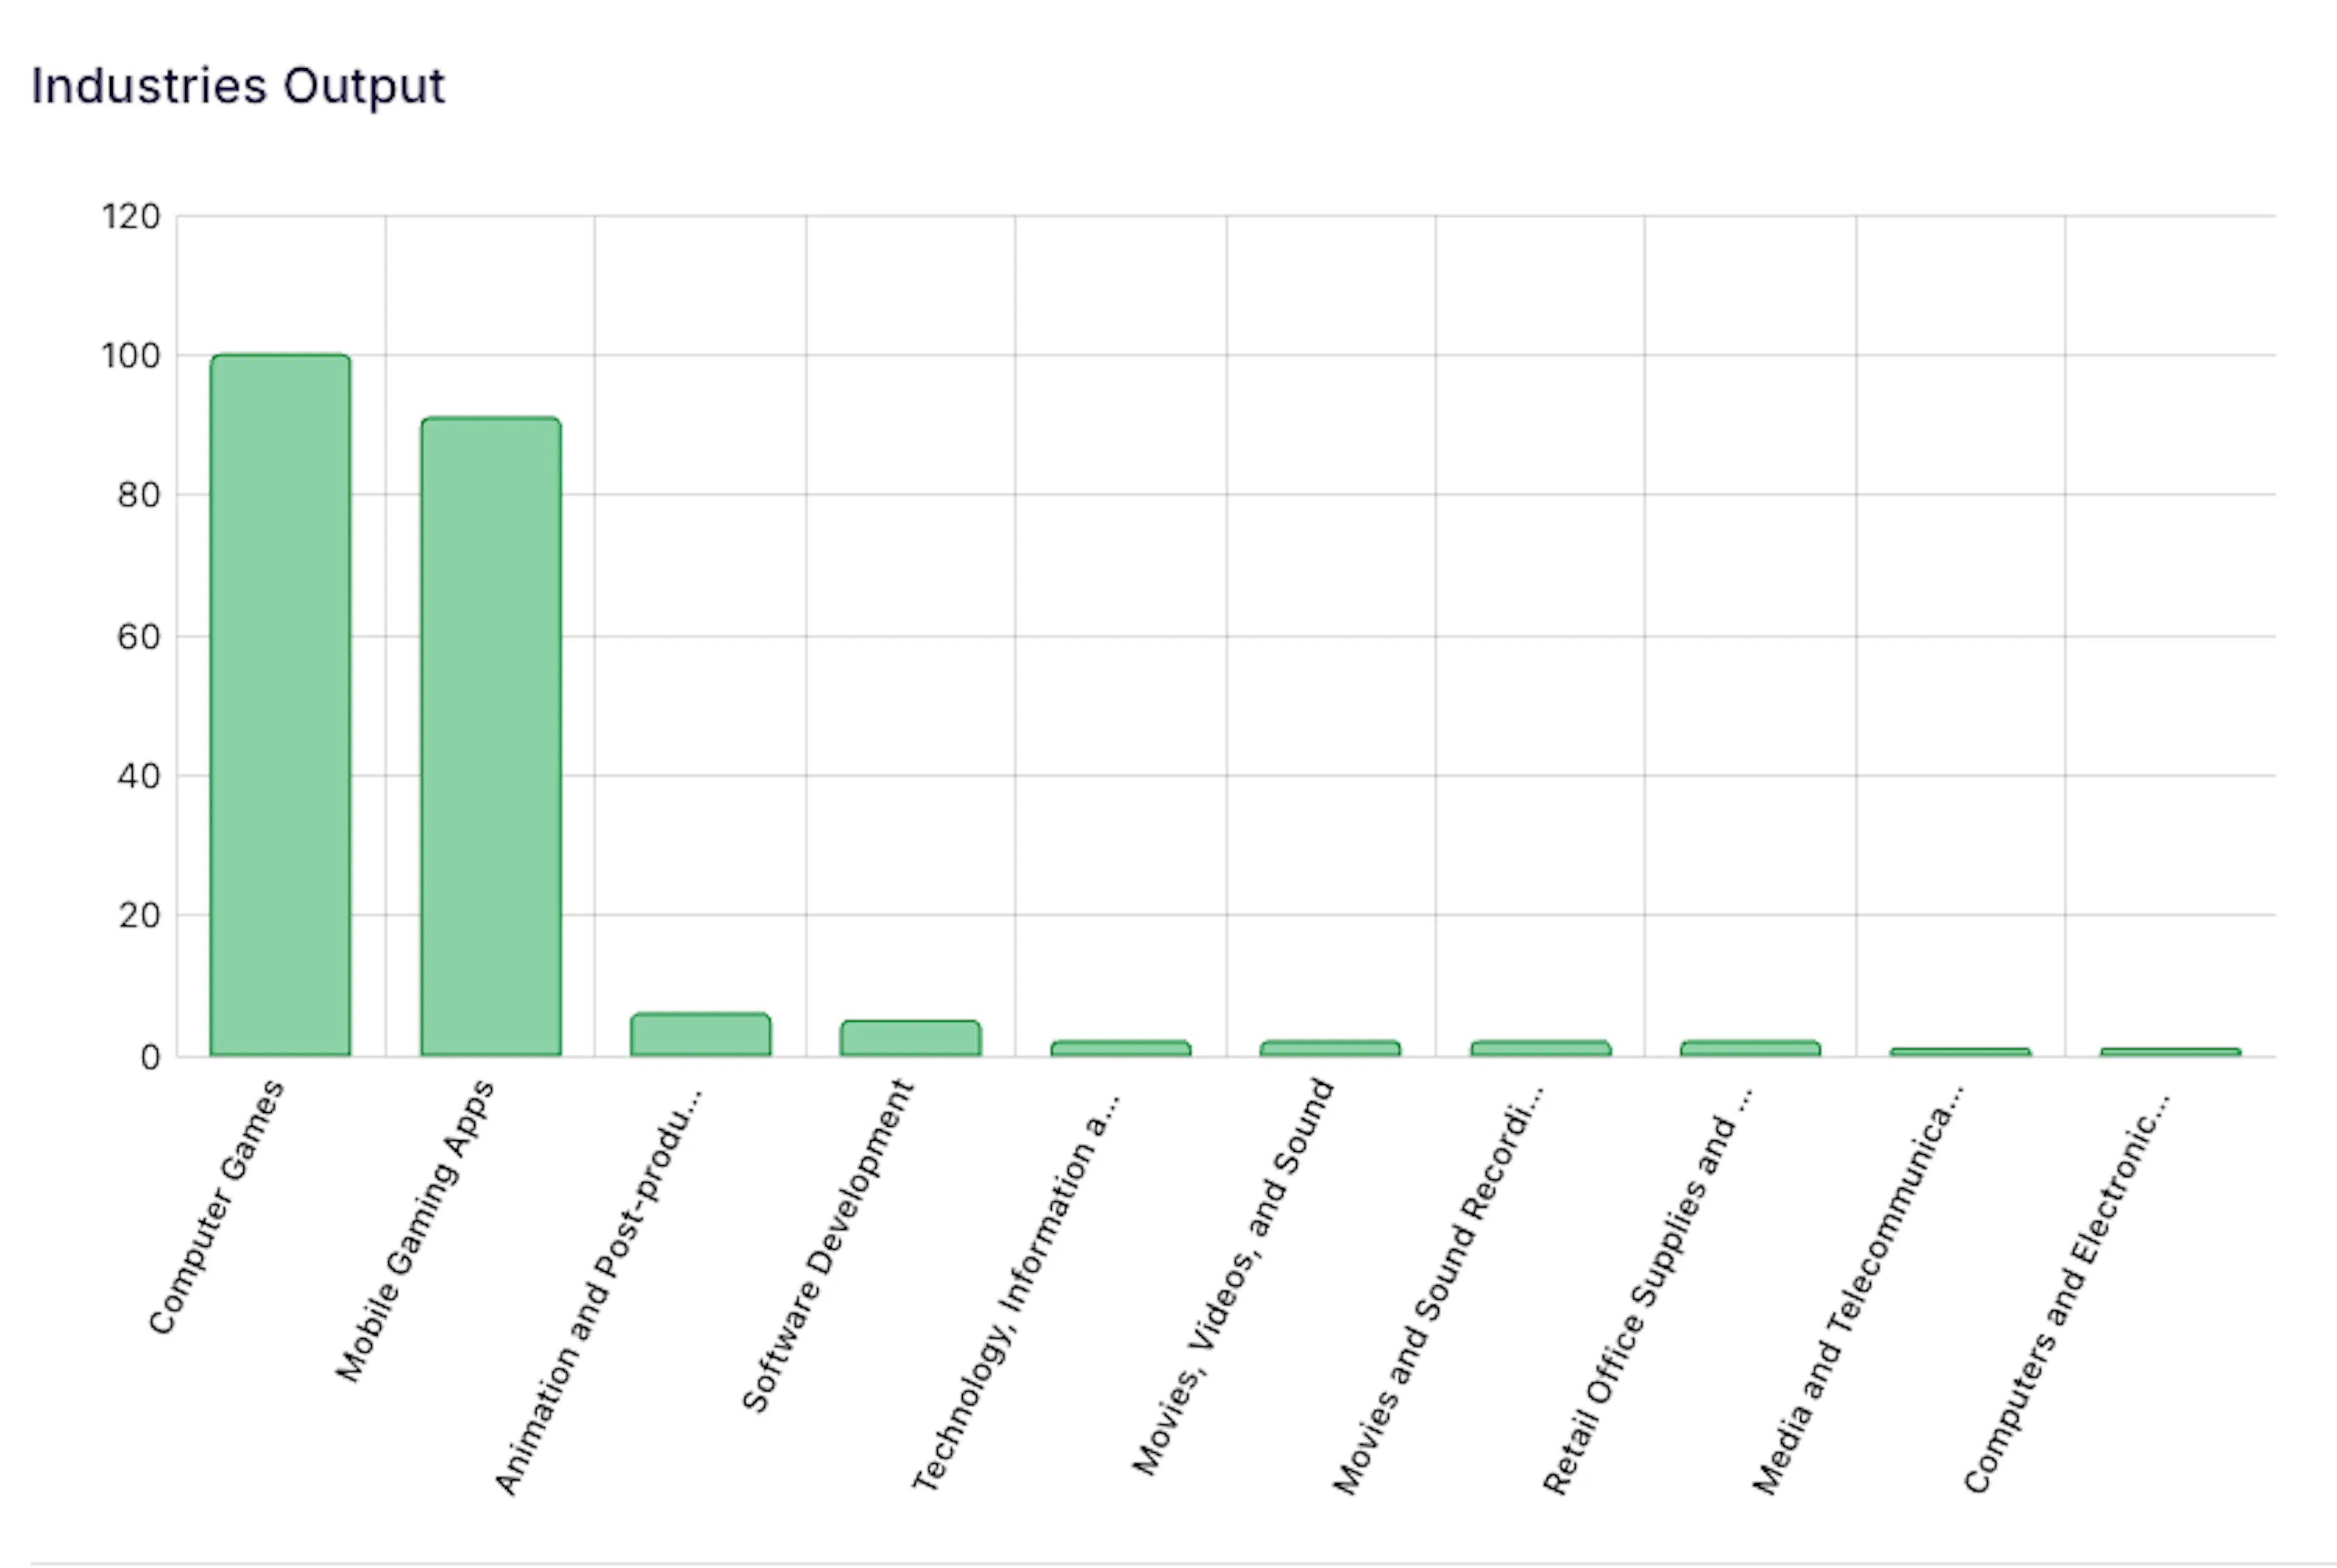
- Industries: whether the audience concentrates in one sector or spreads across several related ones.
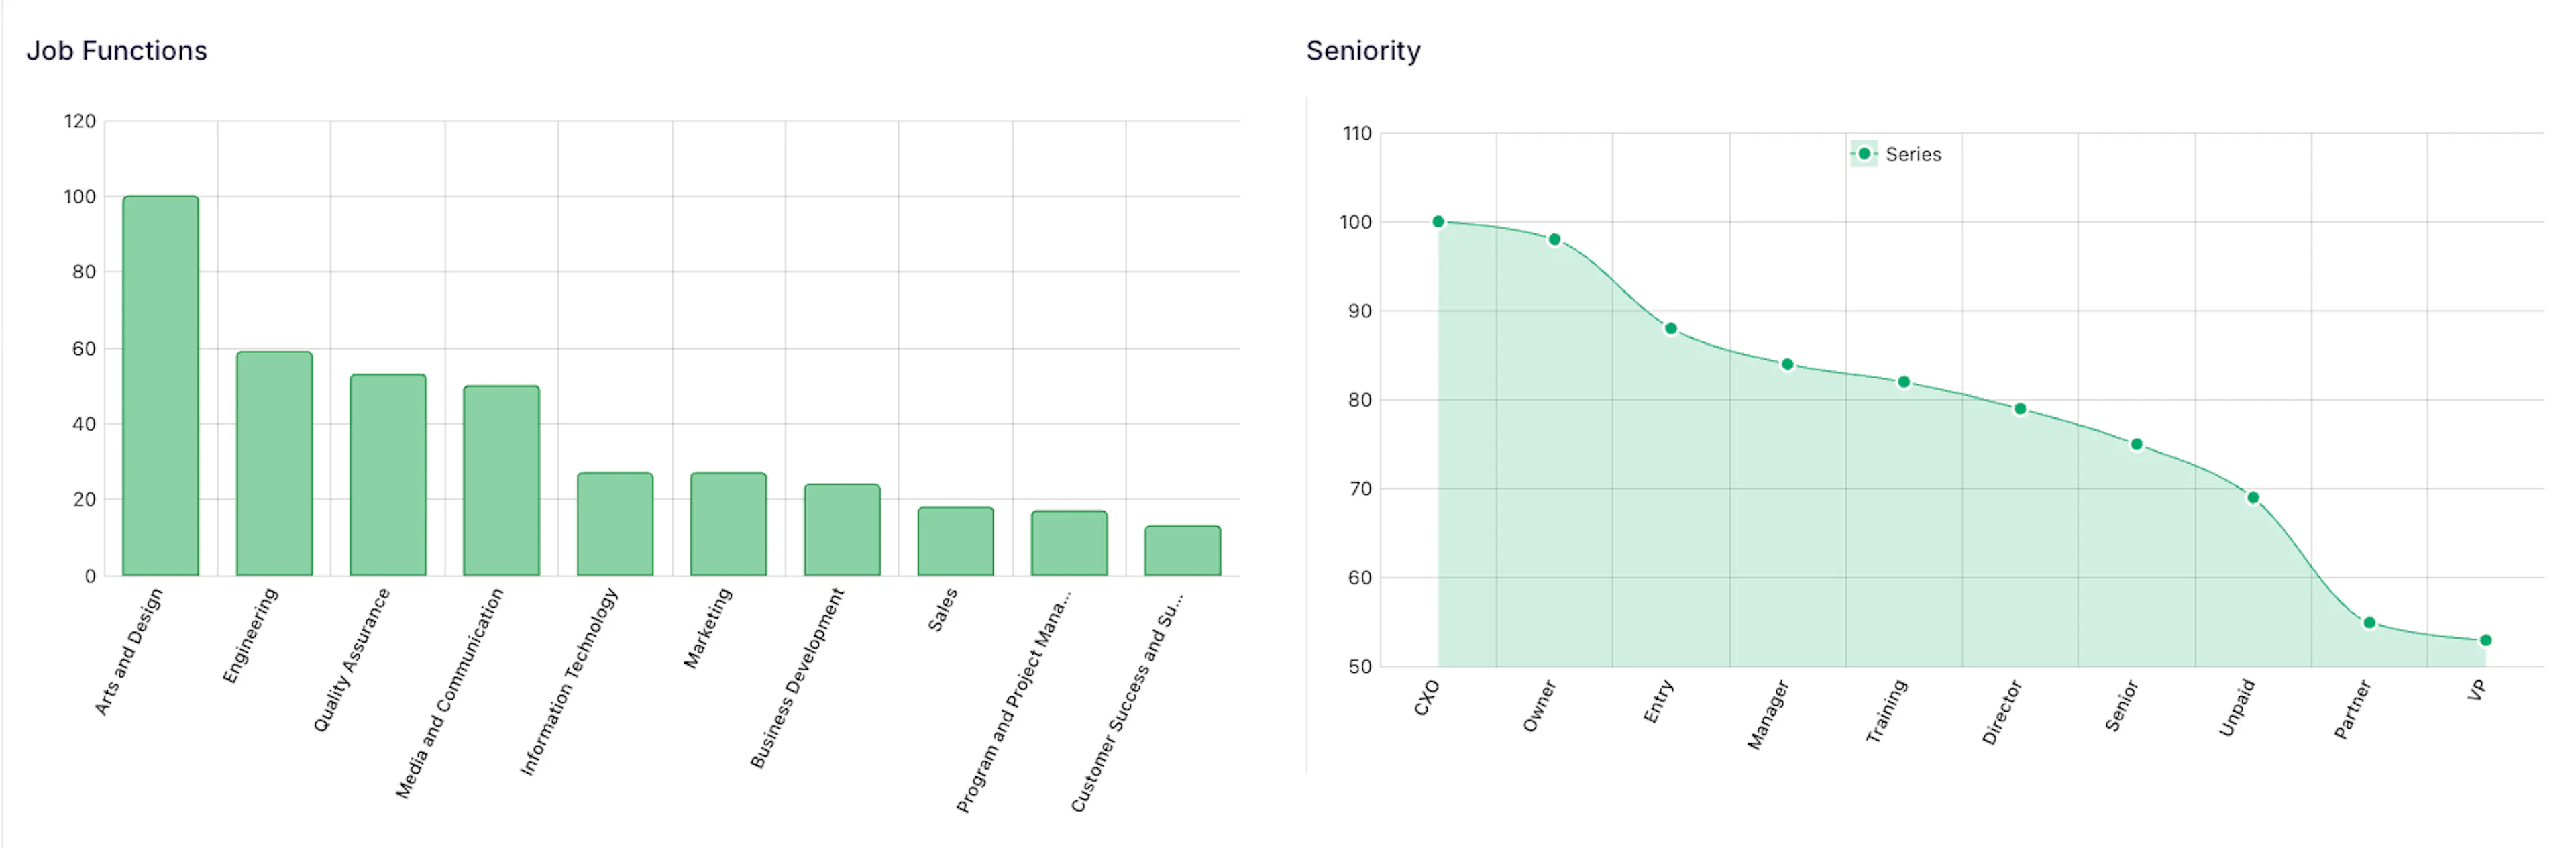
- Job Functions and Seniority: read together, since two people in the same industry can carry very different responsibility and authority.
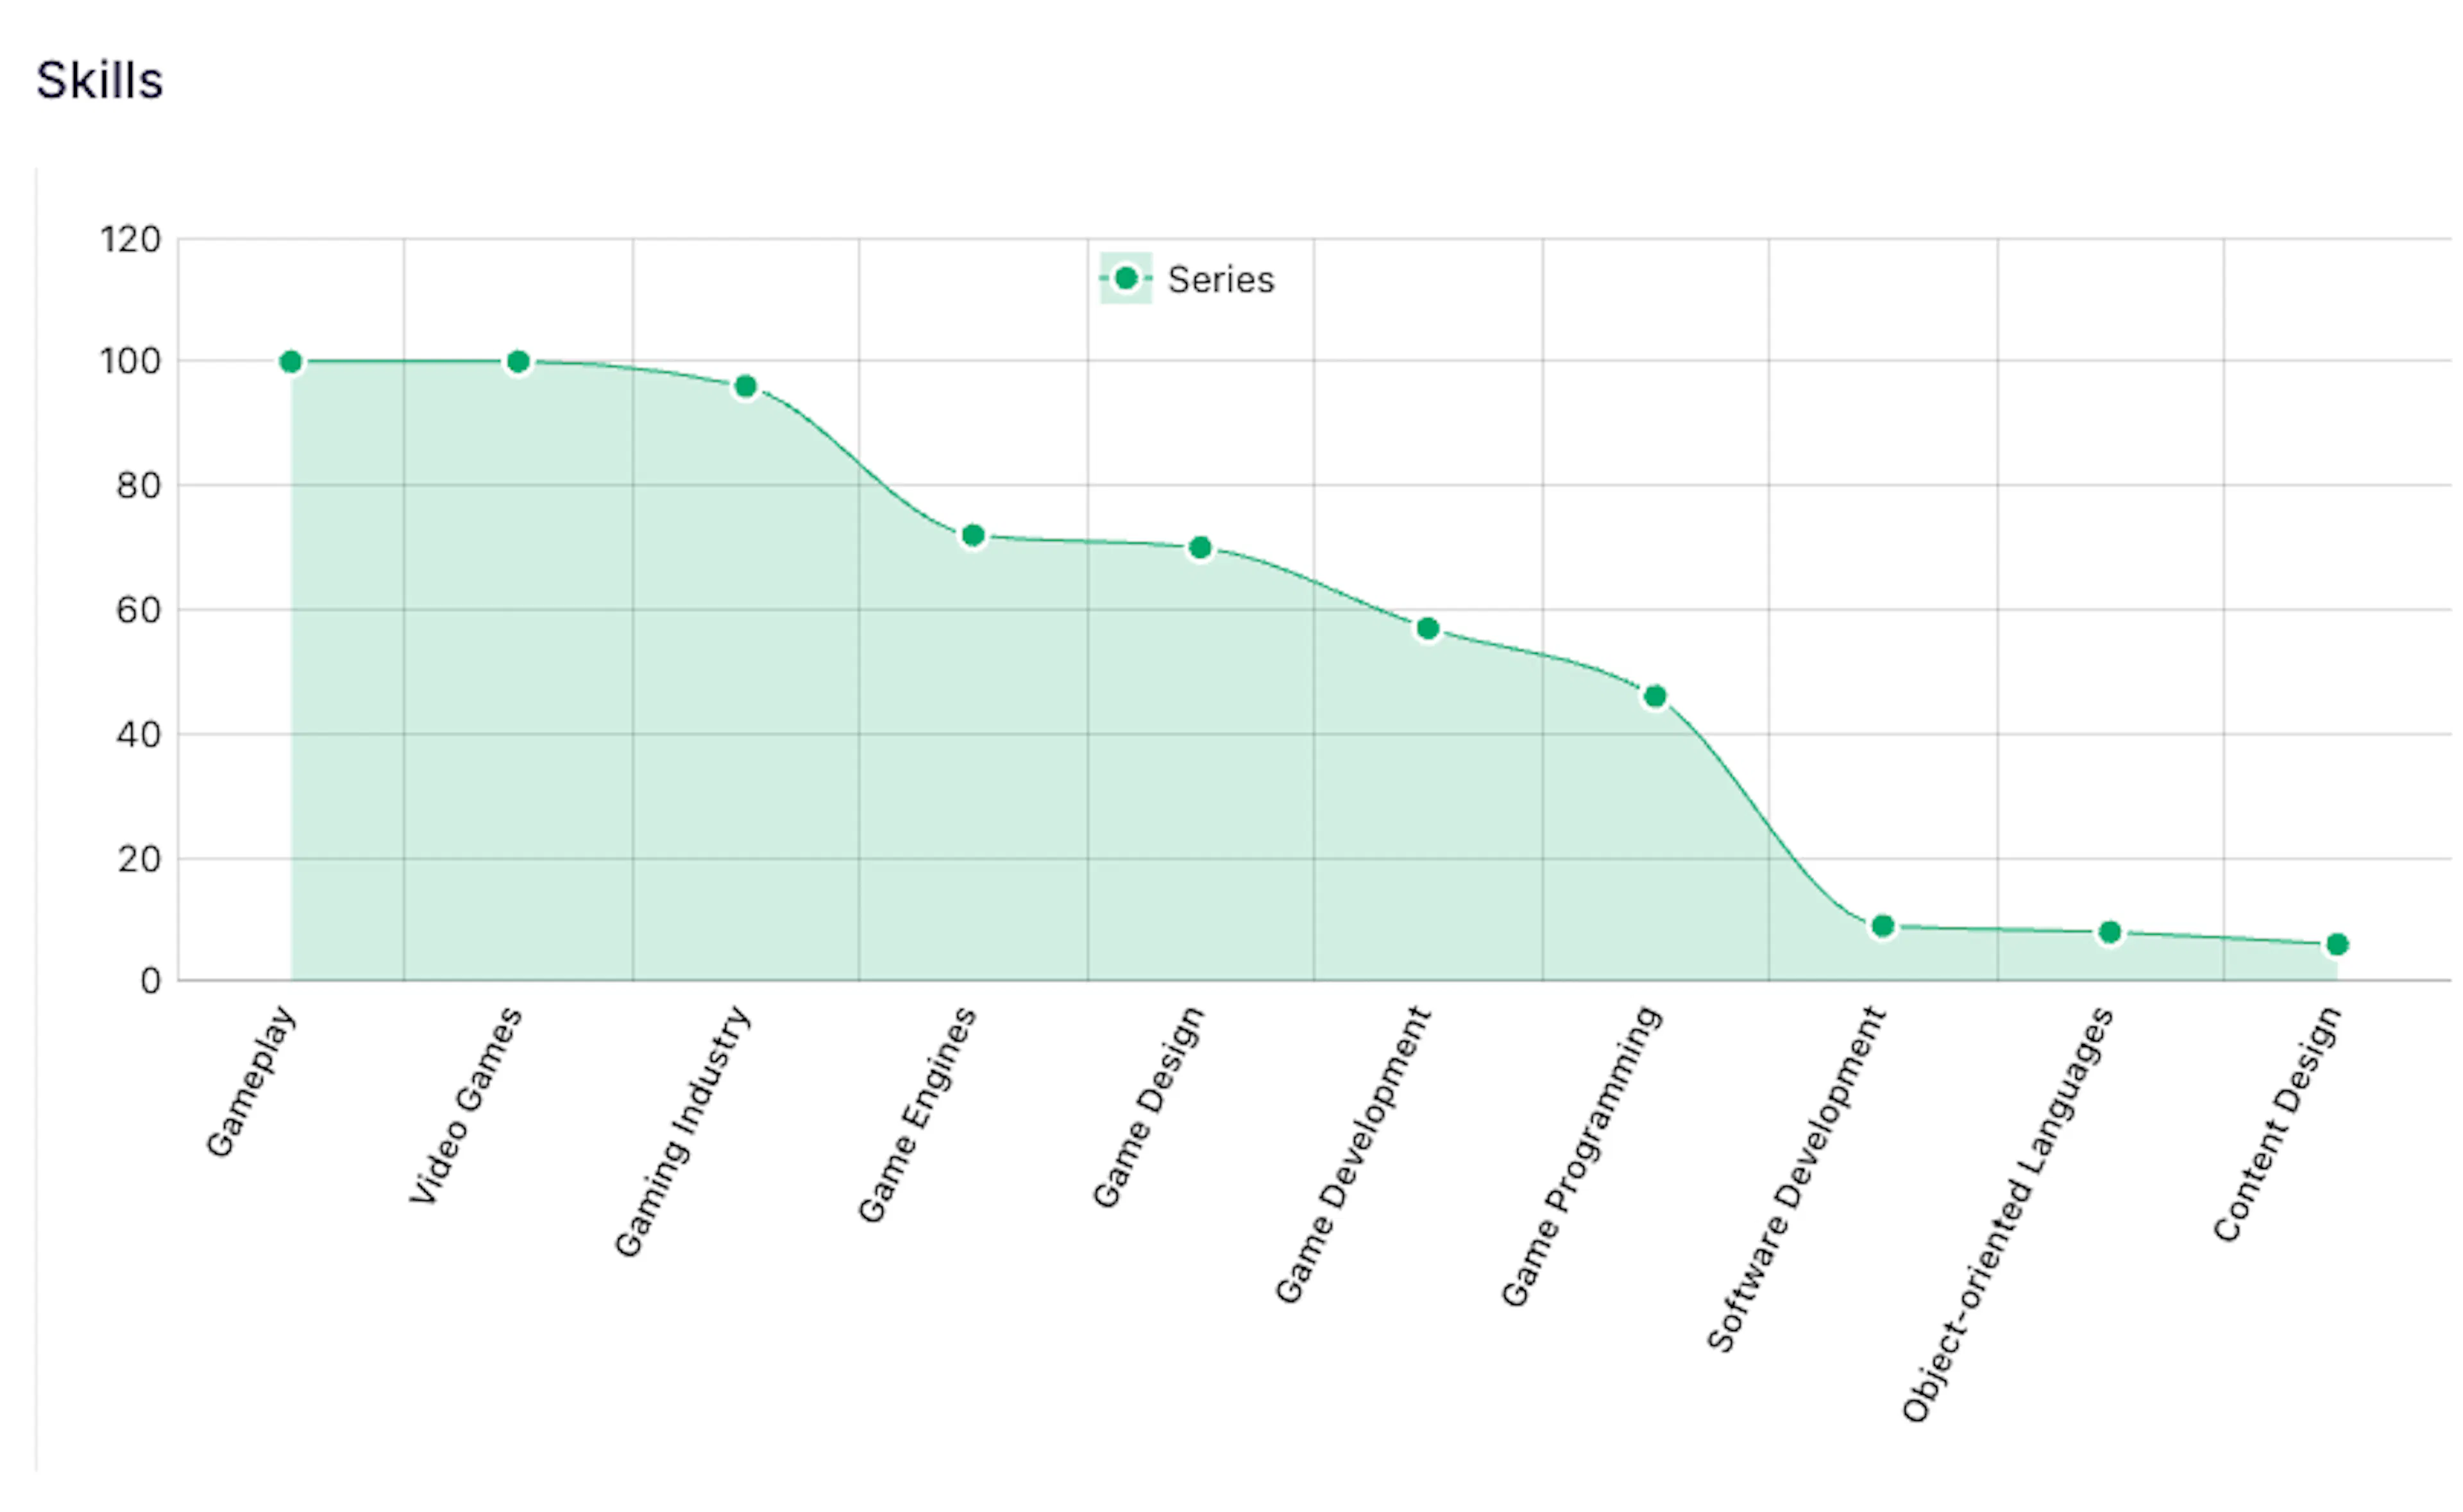
- Skills: the capabilities associated with the audience, useful for calibrating how technical a survey or message should be.
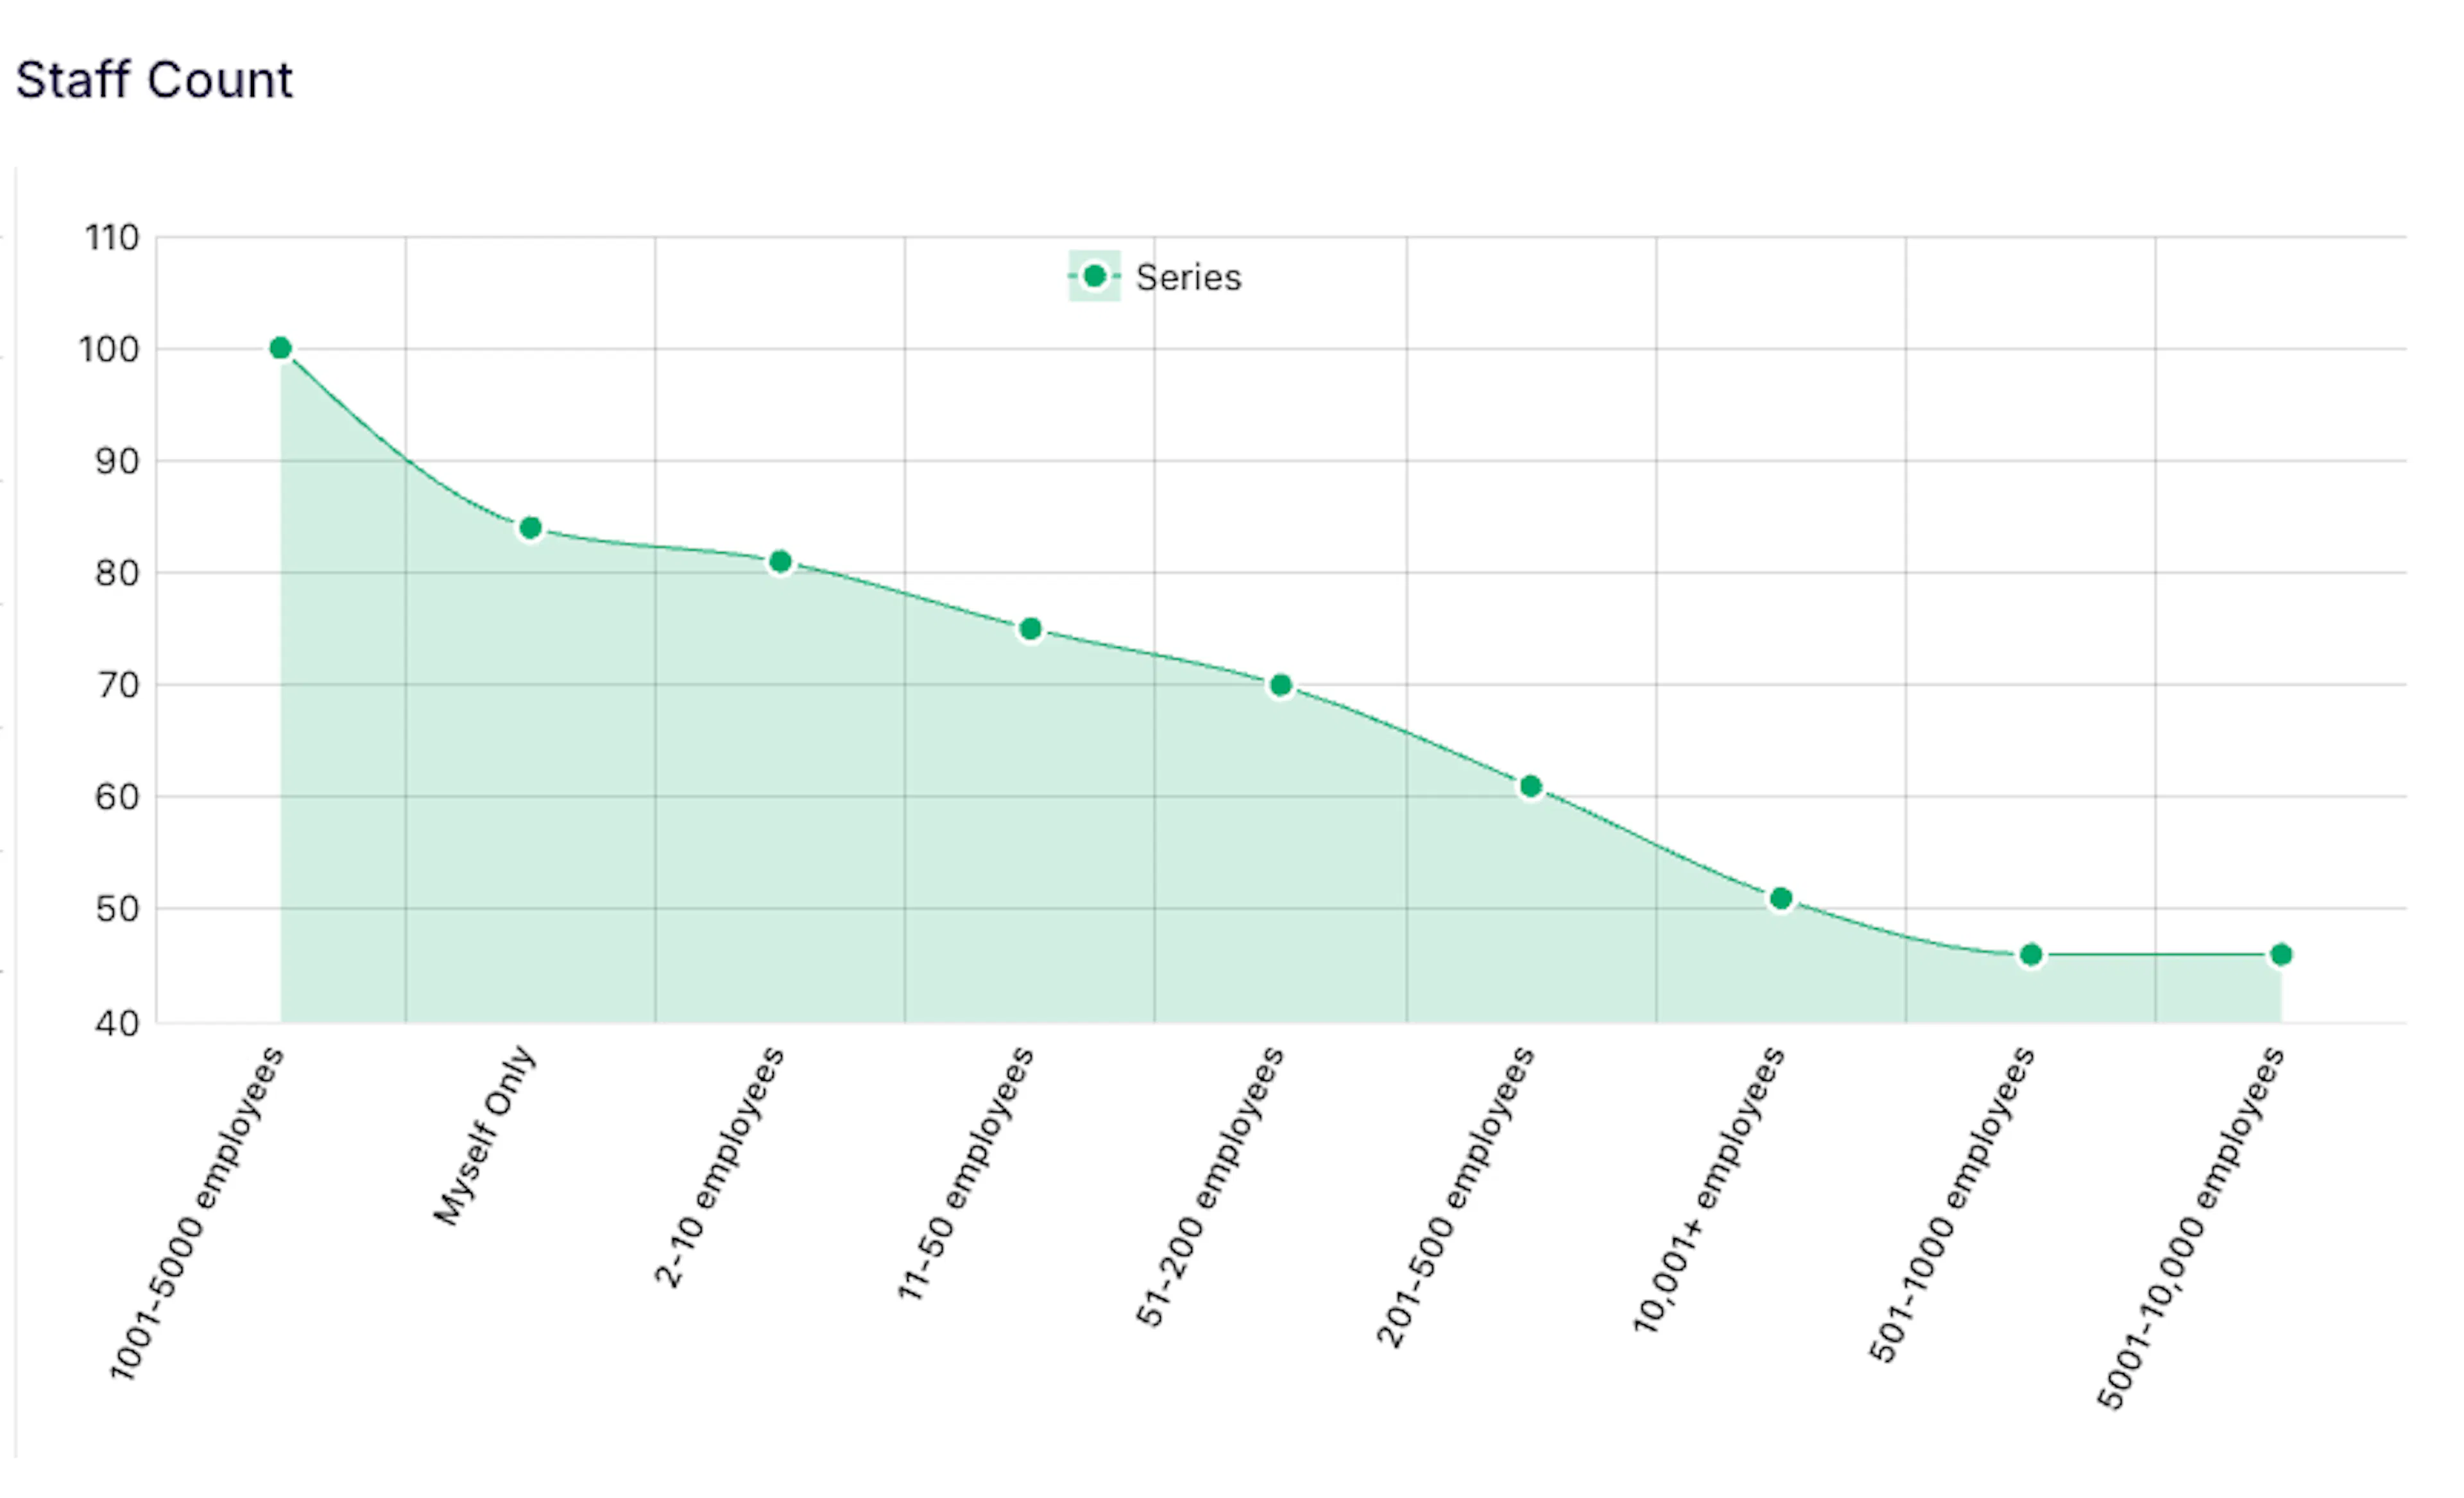
- Staff Count: the organization-size bands behind the audience, which shapes budgets, procurement, and decision complexity.
- Years of Experience: the audience's distribution across experience bands, which affects vocabulary and autonomy more than seniority or purchasing authority on its own.
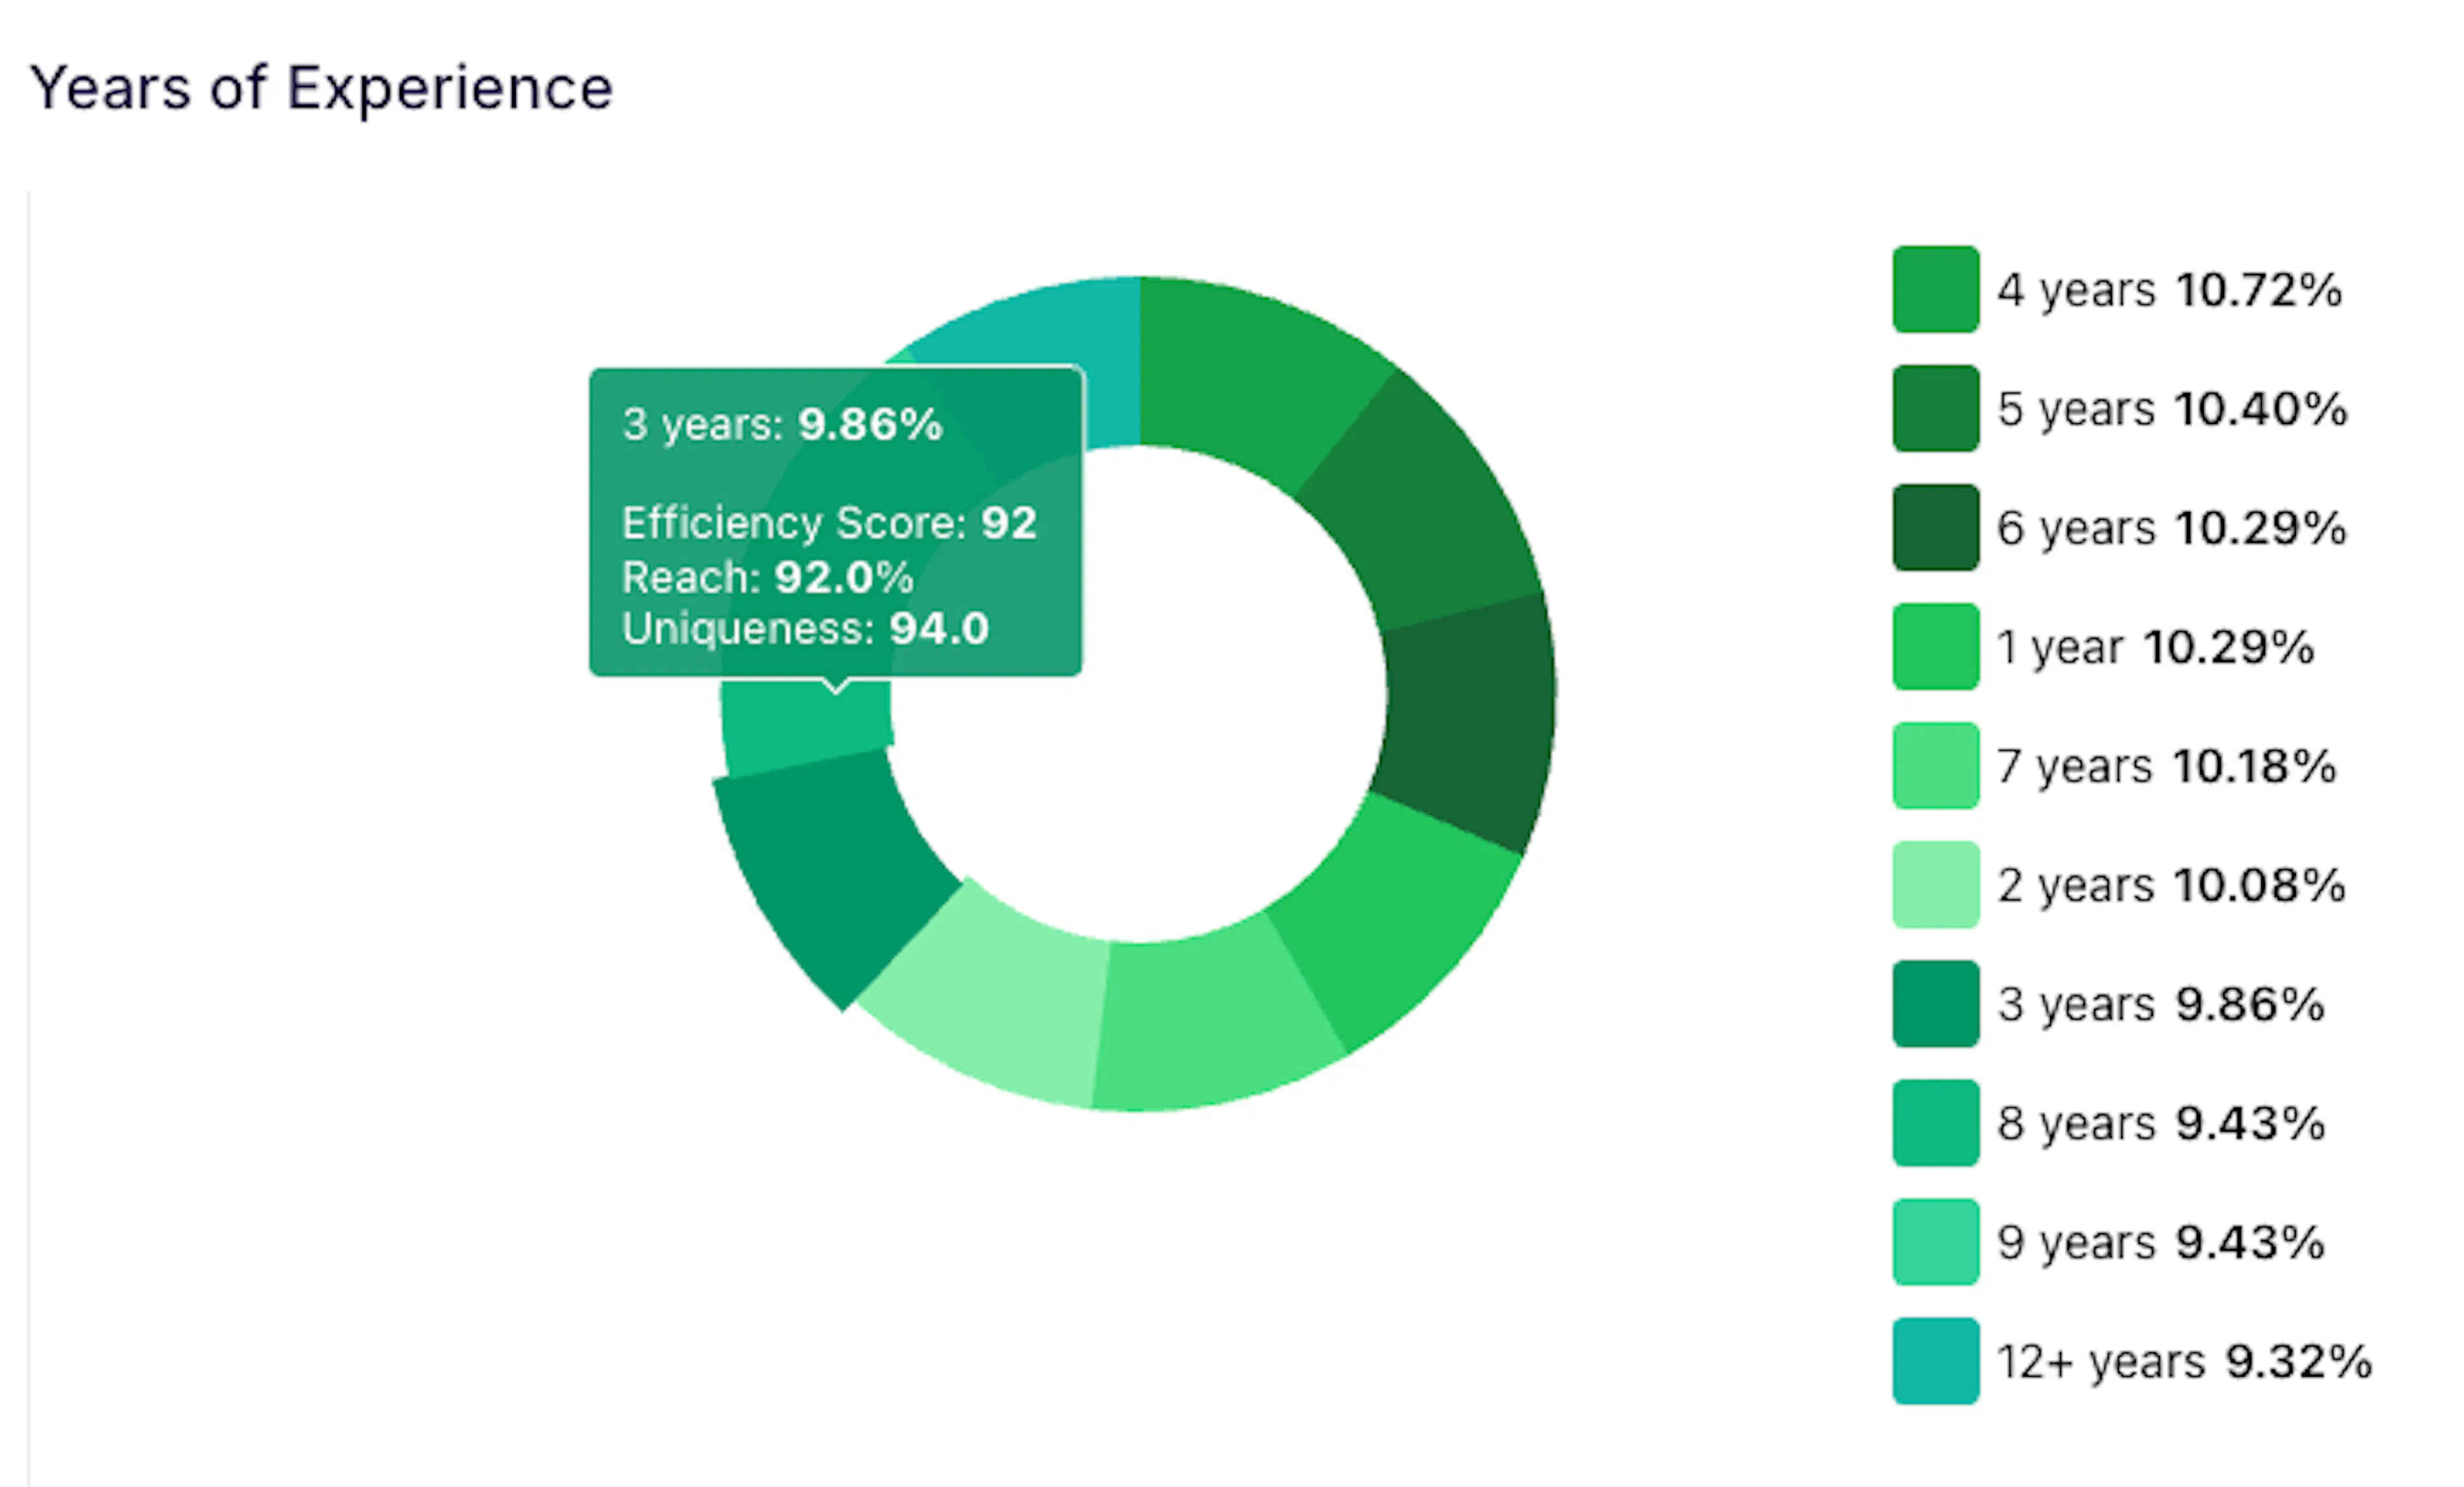
A Professional Behavior report does not support Compare or Schedule Report; Properties is the only tool available in the panel. Consumer Behavior reports support both (see IV. Insights & Intelligence).
What Behavior Insight Will Not Tell You
A Behavior report describes aggregated, long-term patterns, the slow, stable shape of who an audience tends to be. It will not tell you what this audience is searching for this week, a much faster-moving signal (that's Intent Insight), or how they feel about a specific brand right now, in their own words (that's Mentions Insight). It also does not independently confirm purchase, loyalty, demand, or market feasibility on its own. A pattern is not a guarantee. It's the clearest starting point you'll have before the research that follows it.