

Mindset Metrics
An AI Twin is only as accurate as the mindset it represents.
Introduction
The most difficult part of representing a consumer is not describing who they are. It is preserving the complexity of how they think.
A demographic profile can tell us about a cohort's age, income, location, household structure, or occupation. These characteristics provide essential context, but they do not fully explain how the cohort encounters a category or relates to a brand. They do not tell us whether the brand feels familiar or distant, whether its claims are accepted or questioned, whether a purchase is being actively considered, or whether the brand carries any emotional significance.
At consumr.ai, an AI Twin begins with a brief. The brief is where the researcher expresses what they know about the audience: its circumstances, behaviors, relationship with the category, experience with the brand, and relevance to the study. That description remains the primary source of meaning. But natural language contains assumptions that are not always immediately visible. Two people may read the same phrase “a potential luxury-car buyer,” for example, and imagine very different consumers. One may imagine an affluent enthusiast who has followed the brand for years. Another may imagine a first-time buyer who has recently reached the income level required to consider it. The description sounds specific, yet it leaves important questions unanswered.
Mindset Metrics makes those assumptions visible.From the brief, consumr.ai approximates six dimensions of the cohort’s mindset. The researcher can then examine and refine that interpretation. The metrics do not replace the brief, nor do they ask the researcher to begin by reducing an audience to a set of numbers. They create a shared, inspectable language between what the researcher intends and what the system understands. The purpose of measurement is not to simplify but to preserve distinctions that simpler classifications erase.
Beyond A Position In The Funnel
Before Mindset Metrics, consumr.ai used Conversion Stage to describe a cohort as Unaware, Potential, About to Purchase, Existing, Loyal, or Churned. This provided a useful orientation: it located the cohort in relation to a possible purchase or an existing customer relationship. But conversion is not a universal sequence that means the same thing in every market.
The meaning of “close to purchase” depends on what is being purchased. A person may decide which beverage to buy in seconds, choose a software platform over several months, and consider a home for years. The meaning of loyalty changes with purchase frequency. The significance of price changes with income and affluence. Even the absence of a repeat purchase can mean very different things for a product bought weekly and one expected to last a decade.
Conversion Stage is shaped by the economics of the category, the expected purchase cycle, the size and consequence of the decision, and the consumer’s own circumstances. More fundamentally, a stage describes a consumer’s apparent position. It does not necessarily describe the forces that placed them there. Two cohorts may both be About to Purchase, yet have almost nothing else in common. One may be responding to an urgent need, comparing unfamiliar options, and choosing primarily on availability. Another may have followed a brand for years, developed a strong preference, waited for the right moment, and entered the market expecting to choose that brand. Their proximity to purchase is the same. Their knowledge, confidence, attachment, skepticism, and emotional investment are not. If both are represented only by their stage, the distinction most likely to shape their answers disappears.
Mindset Metrics arose from a simple conviction: where a consumer stands matters, but so does the orientation that puts them there.
A Multidimensional Mindset Model
Mindset is not a permanent personality type. It is not a claim that every person within a cohort thinks or feels in precisely the same way. It is also not an abstract psychological profile detached from the subject of the research. Mindset is relational. A consumer is familiar with a brand. They are knowledgeable about a category. They are skeptical of particular claims. They feel attached to something that has earned a place in their routines, preferences, or identity. Their intent exists in relation to a decision, a need, a price, and a moment in time.
This is why mindset can change without the consumer becoming a different person. New information can increase awareness. A disappointing experience can weaken attachment. A life event can create purchase intent. A credible demonstration can answer one concern while leaving broader skepticism intact.
A useful representation of a cohort must therefore allow several conditions to coexist. Mindset Metrics represents this complexity through six quantitative dimensions, each ranging from 0% to 100%.
With six metrics, each on a 0–100 scale, the system allows for over one trillion possible mindset combinations.
This diversity is essential. Real cohorts are not monolithic. They contain variation, nuance, and contradiction. Mindset Metrics captures that complexity without collapsing it into a single stage. This is why anyone creating an AI Twin must define these metrics. They are not optional. They are the foundation upon which every insight, every response, and every research output is built. A poorly defined mindset leads to a poorly defined AI Twin.
Mindset Metrics: An Overview
| Metric | What it measures |
|---|---|
| Familiarity | How much direct knowledge or experience the cohort has with the brand |
| Category Awareness | How well the cohort understands the category and competitive landscape |
| Purchase Intent | How close the cohort is to making a purchase decision |
| Brand Attachment | How strongly the brand is tied to preference, loyalty, or identity |
| Skepticism | How much evidence the cohort requires before accepting brand claims |
| Emotional Affinity | The emotional connection or meaning the brand holds for the cohort |
These metrics should not be viewed independently. The most meaningful insights come from understanding how the metrics interact with one another.
Mindset Metrics is a determinative input. Its accuracy bounds the accuracy of everything downstream.
Deep Dive Into Each Mindset Metric
Familiarity
Familiarity measures how much direct exposure or experience consumers have with a brand. A high Familiarity score indicates that consumers recognize the brand, understand what it offers, and may have previous experience interacting with it. A low Familiarity score indicates that consumers may have limited knowledge or experience with the brand.
High Familiarity:A consumer has purchased a skincare brand several times, recognizes its products immediately, and understands how it compares with competitors. This audience is already comfortable with the brand and may be useful for loyalty research, product improvements, or retention studies.
Low Familiarity:A consumer has heard of a new fitness app but has never downloaded it or used its services. This audience understands the market but has limited personal experience with the brand. Research may focus on awareness barriers or first-time adoption.
Category Awareness
Category Awareness measures how well consumers understand the broader market, products, competitors, and solutions within a category. This metric is separate from brand familiarity. A consumer can understand an entire category while knowing little about a specific brand.
High Category Awareness, Low Familiarity:A consumer follows smartphone technology, knows the major manufacturers, understands specifications, and compares products regularly. However, they have never used a specific emerging smartphone brand. This consumer does not need education about the category. Instead, research should explore what prevents them from trusting or trying the brand.
Low Category Awareness:A consumer has never researched home solar systems and does not understand how installation, pricing, or incentives work. This audience may require category education before evaluating specific brands.
Purchase Intent
Purchase Intent measures how close consumers are to making a purchase decision. A high Purchase Intent score indicates consumers are actively considering a purchase. A low Purchase Intent score indicates limited immediate interest.
High Purchase Intent:A consumer is comparing laptops because they plan to buy one within the next three months. This audience is actively evaluating options but may need stronger proof before selecting a product.
Low Purchase Intent:A consumer is aware of a product category but has no current need or motivation to purchase. This audience may be useful for understanding future demand or awareness-building opportunities.
Brand Attachment
Brand Attachment measures the loyalty-based relationship consumers have with a brand. It reflects whether the brand has become a preferred choice, a trusted default, a part of the consumer's identity, or a brand they actively choose over alternatives. Attachment usually develops through repeated experience, satisfaction, and loyalty.
High Brand Attachment:Imagine a consumer who has used the same smartphone brand for years. They prefer that brand over competitors, upgrade within the same ecosystem, recommend it to others, feel frustrated when alternatives do not offer the same experience. This audience may be valuable for loyalty studies or understanding brand advocates.
Low Brand Attachment:A consumer regularly purchases within a category but sees brands as interchangeable. This audience may be open to switching brands if another option provides better value.
Skepticism
Skepticism measures how cautious consumers are toward brand messaging, claims, and marketing communication. Unlike the other metrics, higher Skepticism represents greater resistance or need for evidence. A highly skeptical audience does not necessarily dislike a brand. They may simply require stronger validation before believing claims.
High Skepticism:A consumer is interested in a health product but wants scientific evidence, reviews, and third-party validation before purchasing. This audience may be interested but needs proof.
Low Skepticism:A consumer generally trusts established brands and is receptive to marketing claims. This audience may respond more positively to messaging focused on benefits and experiences.
Emotional Affinity
Emotional Affinity measures the emotional connection consumers feel toward a brand. This includes feelings such as trust, excitement, identification, or personal connection. A consumer can have emotional affinity even without being a loyal customer.
High Emotional Affinity:Imagine a consumer who follows an outdoor apparel and gear company that is widely recognized for combining high-performance outdoor clothing with environmental activism, and sustainability initiatives. They may appreciate the company's environmental mission, feel positive about what the brand represents, admire its values, and enjoy seeing its campaigns. However, they may own only one product or purchase infrequently due to practical factors, or they may respect the brand without seeing it as something they need or use regularly.
Low Emotional Affinity:A consumer recognizes a brand and may purchase it, but does not feel personally connected.
How Emotional Affinity and Brand Attachment Differ in Practice
| Scenario | Emotional Affinity | Brand Attachment |
|---|---|---|
| Likes a brand's mission but has never purchased | High | Low |
| Uses a brand frequently but feels no emotional connection | Moderate | High |
| Feels the brand represents their identity | High | High |
| Knows the brand well but sees alternatives as equal | Low/Moderate | Low |
| Loyal customer who refuses competitors | Moderate/High | Very High |
How Familiarity and Category Awareness Differ in Practice
| Scenario | Familiarity | Category Awareness |
|---|---|---|
| Understands the category well but has limited direct experience with the brand | Low | High |
| Recognizes/frequently interacts with the brand but does not understand the category landscape | Moderate/High | Low |
| Knows both the brand and the category in depth | High | High |
| Has minimal exposure to both the brand and the category | Low | Low |
How Metrics Work Together
The six metrics should always be interpreted together. There are many possible combinations because they involve tradeoffs. Some examples:
| Consumer Profile | Interpretation |
|---|---|
| High Category Awareness + Low Familiarity | The consumer understands the market but has limited direct experience with the brand. |
| High Purchase Intent + High Skepticism | The consumer is interested but requires stronger evidence before purchasing. |
| High Brand Attachment + Low Purchase Intent | The consumer likes the brand but may not have an immediate reason to buy. |
| High Emotional Affinity + High Purchase Intent | The consumer is both emotionally connected and close to purchase. |
These examples are not fixed rules. Consumer mindset varies depending on the category, brand, product, and research objective. With six metrics, each running from 0 to 100, mindset metrics allow for over a trillion possible combinations, giving researchers the ability to define cohorts with precision rather than approximation.
Creating a Segment with Mindset Metrics
Mindset Metrics are configured during Research Setup** while defining a segment**.

This screen is the configuration step for a segment. Reading it top to bottom:
- Segment Name is a free-text identifier used to reference the segment elsewhere in the platform.
- Summary is a generated description of the segment's demographic and behavioral profile, built from the data sources connected to the segment; it gives a fast, plain-language read of who this population is before any mindset work is applied.
- Current Mindset Label is the plain-language summary of the mindset vector below it, in this example describing a segment that is digitally engaged and already in active consideration rather than early awareness.
- Mindset Metrics Sliders: Define the six psychological dimensions of the audience. Researchers can adjust each slider to create the desired consumer profile.
In this configuration:
- Familiarity sits at 68%, and Category Awareness at 66%, both comfortably in the engaged range. Here the two move together, which is one plausible pattern, though as noted above, a segment can just as validly carry high Category Awareness with much lower Familiarity if it represents people who know the landscape but haven't yet used the product.
- Purchase Intent is at 58% and Brand Attachment at 55%, placing this segment past initial consideration but short of firm commitment or established loyalty.
- Emotional Affinity is at 62%, moderately above the midpoint, suggesting the pull toward this brand is somewhat more emotional than purely rational.
- Skepticism is at 34%, which, read in reverse per the interpretation rules above, means this segment is relatively trusting of marketing claims rather than resistant to them.
Read together, this is a segment that already knows the brand and category, leans emotionally toward it, is meaningfully but not fully bought in, and is not defensive about being marketed to. That combination points toward research that tests specific purchase triggers or offers, rather than research aimed at building basic awareness, since awareness is already established here.
How Respondents Are Generated in Quant Surveys
Once Mindset Metrics are configured, the six scores become the psychological baseline for the segment. Respondents are generated with natural variation around this baseline. This means individuals within a segment will not have identical attitudes, but the overall population will reflect the intended mindset.
For example, a segment defined as highly skeptical may include respondents with different levels of skepticism, but the overall audience will require stronger evidence compared with a more trusting segment. When larger respondent populations are generated, the configured mindset profile helps maintain consistency with the intended audience characteristics.
How to Interpret the Metrics
Each score runs 0-100%, and interpretation depends on the metric:
- Below roughly 40% on Familiarity, Category Awareness, Purchase Intent, Brand Attachment, or Emotional Affinity indicates the segment is early-stage on that dimension: unaware, unattached, or far from a decision.
- 40-70% indicates a segment that is engaged but not yet convinced or committed. This is the most common working range for an "in consideration" segment.
- Above 70% indicates a segment close to, or already past, the point of decision or loyalty on that dimension.
- Skepticism reads in reverse: a low score means claims are generally trusted, a high score means the segment actively doubts marketing messages and will need stronger evidence or proof points before responding positively.
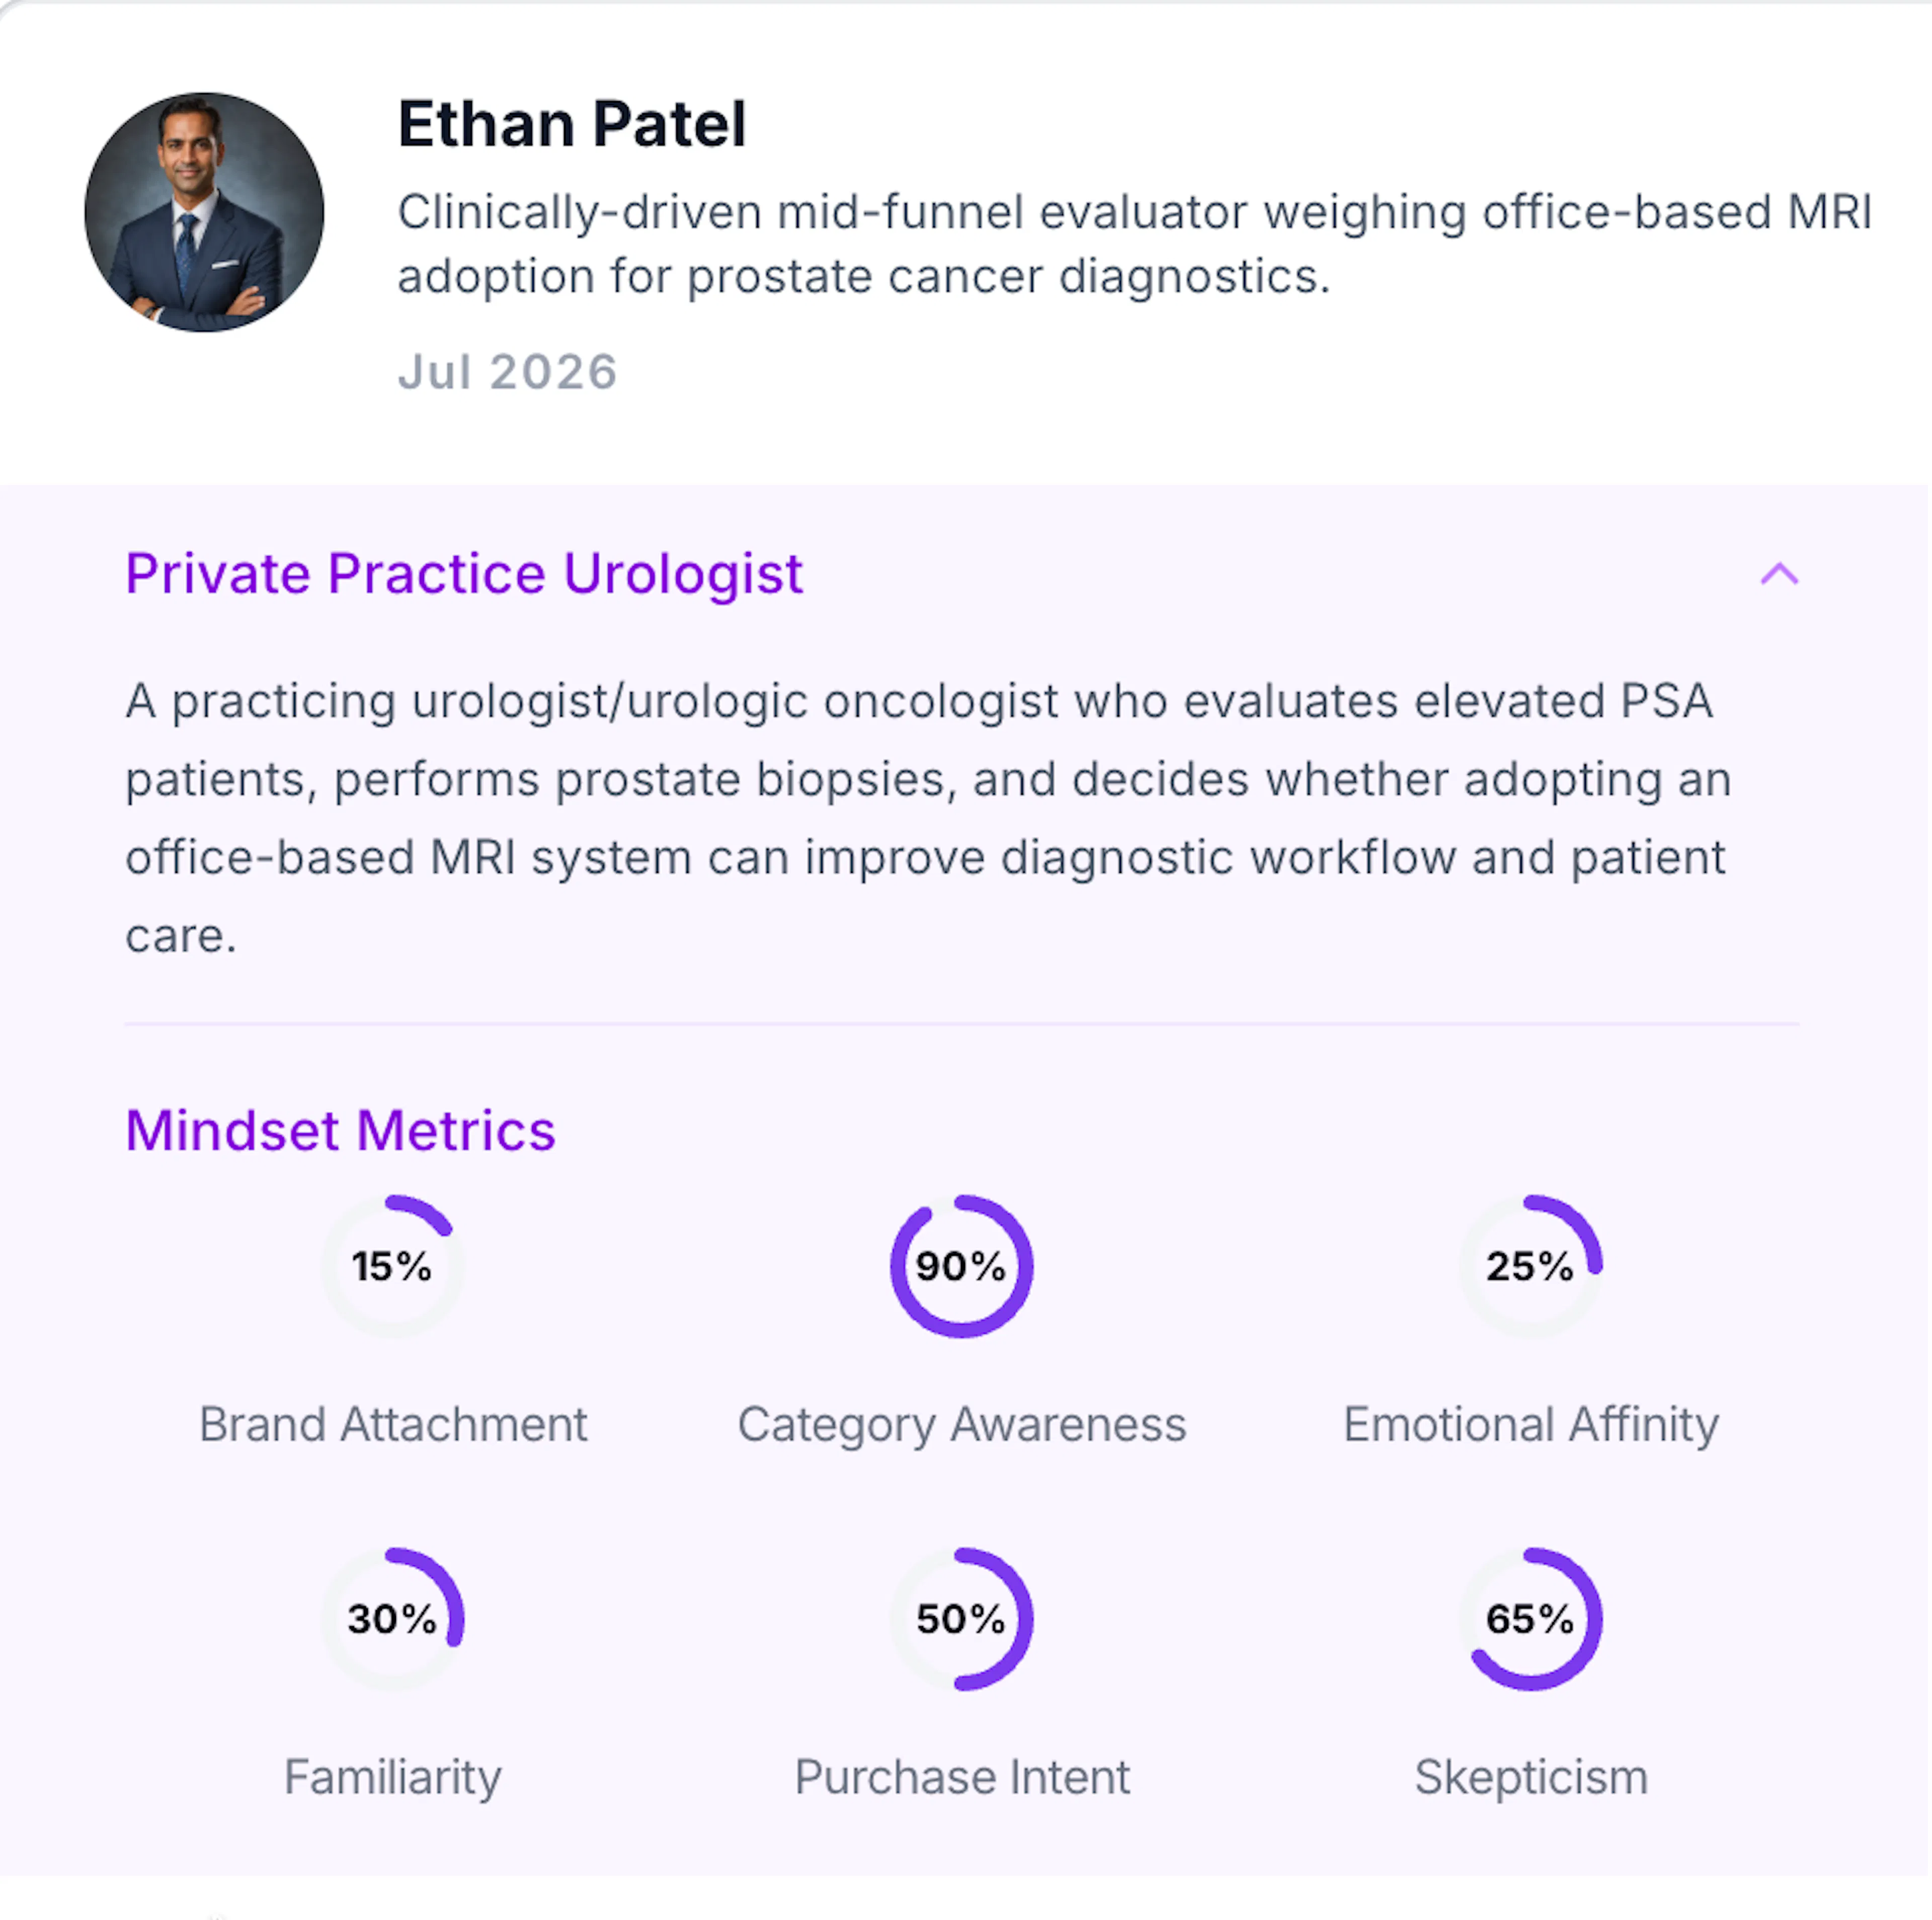
The most accurate interpretation comes from examining the relationship between all six metrics rather than evaluating individual scores alone.
Limitations
Mindset Metrics describes thecenter of a segment's mindset, not the position of any one individual within it. Real audiences contain outliers on every dimension. A segment scored at 58% Purchase Intent still contains individuals much closer to, and much further from, a purchase decision. The score is a population-level calibration, not a per-person prediction.
The six scores also only measure mindset and perceptions only.They do not encode demographic composition, media behavior, or channel preference; those live in separate parts of the segment definition. Setting Mindset Metrics accurately does not substitute for defining the segment's demographic universe correctly, since the two describe different things and are combined, not merged, downstream.